INTRODUCTION
OBJECTIVES
INTRODUCTION TO STUDYSITE
FUTUREWORK
ACKNOWLEDGEMENTS
QUESTIONS
REFERENCES
INTRODUCTION
Snowmelt is a significant surface
water input of importance to many aspects of hydrology and water resources
management. Snowmelt is primarily driven by energy exchanges at the snow surface
that have variability down to scales of 1 to 10 m. the physical processes
reponsible for snowmelt at these point scales are relatively well understood and
modeled by a variety of 'point' models.
Snow hydrology has evolved over 35 years. Topography, radiation and vegetation are the primary controls on the spatial variability of snow accumulation and melt in the alpine and semi-arid areas. The linkage between snow surface energy input and topography is key to the work in this project, because topography is readily quantifiable through the use of digital elevation models (DEMs).
In my snowmelt modeling, the modeling process is shown as:
OBJECTIVES
- Develop techniques for the representation and parameterization of subgrid and distributed snow processes within snowmelt models.
Dr. David Tarboton and Charlie Luce have developed the Utah Energe Balance model. This model is an energy and mass balance based model. It is suitable for thepoint snowmelt modeling. In my term project, I started with the learning and understanding the model. Then running this model over some study site to calibrating some parameters for the special locations and sites.
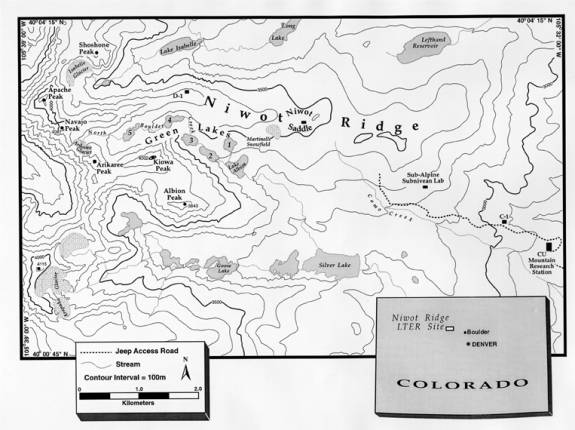
The modeling is carried out over the Green Lake Basin in the Colorado Front Range. This small basin and another watershed -- Loch Vale Watershed is used for our modeling for the development of tools for the large basin snowmelt and distribution modeling. The final result of the project is to develop the relationship of the scale and depletion curves for different scaled watersheds. Colletion of data is the the basis of the project. In my term project it tell me how to dig the useful information for the modeling and the research especially the data for the GIS. Different data is needed for different purpose. And the requirement of the data are increased during the procdure.
- Snowmelt proccess modeling in UEB Model and SnowGRID model
In my term project, the snowmelt modeling is carried out by steps. At first the point model (UEB). UEB is a suitable model for this job. After modeling by UEB, the snowmelt processes at different sites are described.
For the snowmelt modeling, (not only for the modeling but also for the snowmelt process), the weather, vegetation, and topography is the main influence to the snowmelt process. Other than modeling in GIS by develop some equations over a sort of GRIDS, the snowmelt modeling need the input of the weather data. Weather data is time series scaled data, and can not be introdued into ARCVIEW once. The techniques plan for the modeling is get the neccessary data (Initialization data) from GIS and then run models by applying the data from GIS. It is an alternative for modeling by GIS.
For the SnowGRID, GIS is closely related in the modeling, the DEM grid, Slope grid, Aspect grid, View Factor grid and other grid is the input of the SnowGRID model. By running the SnowGRID model, the snow distribution over the watershed are output. This process can be used to predict the snow depth and the snow water equivalence over the watershed in different dates. And the snowmelt process of the cells and the whole watershed is illustrated.
The UEB and SnowGRID are the models closely related to the GIS. My term paper is to study the GIS by the snowmelt modeling.
INTRODUCTION TO STUDY SITE
PROJECT PROCEDURE
Step 1: Data Collect
1) Retrieving the data for snowmelt and distributed modeling
a. Download the DEM data form the USGS website. For my project I downloaded the 30 m DEM for the modeling. Because the watershed is over different DEMs, I used the gapfill program by Dr. David Tarboton to merge them and form a whole DEM of the basin.b. Download hydrological information from other website. The website where I downloaded the file is the official website for the Niwot watershed --Niwot Ridge (Colorado) Long-Term Ecological Research. From the website I downloaded the data such 10*10 m grids as DEM, geology grid, and hydrology grid. This set of data is better than that from theUSGS. However, it require the computer be better than that needed by the data form the USGS.
1. Geographical Dataftp://129.82.105.152/pub/tarboton
From this FTP site I downloaded the pitdata, the weather data, the snow depth map data. the snow covered area map data. These data is in the IPW format. I use the following command to get it opened in ARCVIEW.
primg -a -i *.ipw
prhdr *.ipwThe edit the ASCII file and add the ArcInfo head to the grid, then it works and can be load in to arcview.
ncols 600
nrows 350
xllcenter 444710
yllcenter 4431950
cellsize 10
nodata_value 0http://culter.colorado.edu:1030/Niwot/Geographic/NWT_LTER_demortho.html
From this site I download a ARCVIEW Model for the Niwot Ridge. It is produced using Arcview 2.0.
http://culter.colorado.edu:1030/Niwot/Geographic/NWT_LTER_glvgis.html
Here I found the hydrological, geological, vegetation grids for the modeling Green Lake Basin. A coregistered, georeferenced Geographic Information System (GIS) database of the Green Lakes Valley (GLV) was developed using new digital elevation data and digital color infrared orthophotography in conjunction with previously digitized thematic layers for soils, landcover, geology, and hydrography.
The metadata can be found in the following formats:
- Erdas Imagine native format
- Generic Binary format
- Generic ASCII format.
The Green Lakes Valley (GLV) dataset is defined spatially as:
Spatial Resolution: 10 m x 10 m
Boundaries:
- Upper Left UTM: 444710, 4435450
- Lower Right UTM: 450700, 4431960
UTM Zone 13 North, WGS84 Datum
There are 600 columns and 350 rows in the dataset (6.0 km x 3.5 km).2. Vegetation data;
Vegetation cover is important to the snowmelt process, it given significant effect to the the snow drift and the radiation input for the snowmelt. in addtion to affecting the wind velocity distribution and interception, which influence snow accumulation and distribution, a forest modifies the energy flux exchange processes which change snowcover erodability, mass and state. a 10*10 m grid for the vegetation was retrieved rom the Niwot official website. Se the above item.
3. Measured Pitdata;
The modeling of snowmelt can be tested by the comparison of the modeling results with the measured data. The efficiency of the model is proved by the measure data. Only after the testification, can the model be used for the predict and forecast of the snowmeld process and distribution. From the website and Dr. Kelly Elder in the University of Colorado -- Boulder, I get the pitdata.
4. Snow Water Equivalence Data.
The snow water equivalence data is another neccessary measured data. From the website of the snow survey under the U.S. National Weather Service surveys North American http://www.nohrsc.nws.gov/quiklook/usql.shtml I can download some snow cover data for the large area. For the snow water equivalence and snow cover area for the snow watershed we have to seek helps from other sources. The same with the weather and climate data. These data are from individual study sites. These data is better for the watershed modeling.
Step2: Delineating the watershed and river network
Dr. David Tarboton has developed a set of programs to burn in right for the watershed, flow direction and river network produce. The core programs are integrated in Sinmap and Tardem. The D8 and Dinf methods for the determination of the flow direction have been used in the software. Detailed information for these software and methods can be found in in Sinmap and Tardem under Dr. David Tarboton's homepage.
The process of this step is:
Merge the DEMs: select all grid themes and do Edit/Merge grids.
Gapfill: Use the gapfill.exe for the gapfill, the gaps between the dems are filled by averaging from the grid cells on either side.
Pit fill: It fills the sink pits for the dem.The following commands are for the delineating of the stream channel network and the watershed. I used this commands to delineate my study watershed: Green Lake Basin. the output are shown as following grids.
D8 Method: Get the flow direction by the D8 Method.
Dinf: Get the flow direction for the triangle facet method .
Aread8: Get the contributing area from the D8 mehod flow direction grid.
Areadinf: Get the contributing area from the Dinf flow direction grid.
Netsetup: Channel networks maping.
Arcstreams: defines the channel network and input them into ArcView as a vector feature data file. Streaman
Subbasinsetup: Delineate the subwatershed for the watershed.Green Lake Valley watershed. Produced by Sinmap and Tardem.
The DEM for the watershed delineate. This part is after cliping with the boundary of the watershed.
The contribution area of the Green Lake Basin.
The delineated stream channel network and the subwatershed of the Green Lake Basin.
Step 3: Fit the sites to the modeling watershed.
I get the weather data for the weather gage stations in the watershed. I used the UTM coordinate transform tool, unified the coordinate to the geographical coordinate and introduce them to Arciview overlapped by the DEM. Thus I find out the location of the gages. Meanwhile I downloaded and asked for some important data (Pitdata for a lot of points, snow covered area data for the watershed, snow water equivalence data for some specific dates.)
As shown in the above picture, the measured snow depth data and the pitdata sites were uniformed to the watershed. They became a single system which can be used for the snow modeling comparison. After the coordinate system transform. All the grid data (such as DEM, Geology, SWE, etc), the feature dataset (pit data, snow depth data, gage and so forth) are in the same project. With this project, it is easier for me to continue the following work and have a direct view.
Step 4: Implementation of UEB (Point MODEL)
1. Location of the modeling sitesBefore modeling, you should have a explict concept of where your modeling watershed is, what is the data you can get, and the location of the modeling sites. The location of the modeling sites is very important to the representation of the modeling. The good location of the modeling sites can ensure your modeling and predict. The same rule, the bad locations will destroy your study. Fom the study sites map, the four gages locate at the east, west, and north part of the basin repectively. It is good. the only shortcoming for the modeling is there is no gages locate at the south part of the watershed.
2. Modeling Results:
Implementation of UEB for the snowmelt modeling in three gages and two series of data in Niwot (1994 and 1995) are adopted in the early stage of the point snow modleing. Then I got anohter data set for the watershed (refer to the data collect part). From the above study site data site fitting picture. I have four measured snow dataset for the watershed point snowmelt modeling. The three site is not too good because in such a watershed the data collect is more difficult than we have expect. The data is enough and has good quality for my point snow modeling.
For the snowmelt process modeling, the important parameters that can tell you how the snowmelt goes are the snow melt rate, the cumulative melt rate and the snow water equivalence curves. The point modeling results can be seen in the following pictures. The output snow water equivalence and cumulative snowmelt are shown.
Step 5: Subgrid Distributed Snowmelt Modeling
The first step: input the GRIDs into my program. The gridio system are adopted in my program. In my program, all the grids are read using the gridread(), and written using the gridwrite(). The program can be shown in the following picture. The slope, aspect for the purpose of the radiation computation are derived from my program. These grids is different from that for the flow computation.
The second step: Interpolating the weather data. The time steps for the modeling is of large number. The interpolated method provided in ArcView is not suitable for my purpose (I download all the arcscripts from the ESRI website and cannot find a kind of the interpolation method for my job). Meanwhile, there is not many measure gages. Now I used the simple interpolation method -- linear interpolation method. With the job continuing, other interpolation method shall be integrated into our model.
The third step:
Model running.
The flow chart of GRIDSnow Modeling:
Modeling output:
Modeling Snow Water Equivalence Map in Green Lake Valley Basin
CONCLUSIONS
3. GIS is a
powerful tool for the snowmelt modeling. It saves time and gives a more direct
geographical concept.
FUTURE WORKS
- Interpolation method for the modeling data
- Subgridization
- Depletion Curves Method
- Scale Factor in the Snowmelt Modeling
ACKNOWLEDGEMENTS
QUESTIONS
REFERENCES
Luce, C. H., D. G. Tarboton and K. R.
Cooley, (1997b), "Spatially Integrated
Snowmelt Modeling of a Semi-arid Mountain Watershed," Proceedings of the
Western Snow Conference, Banff, Canada, May 5-8, 1997.
Luce, C. H., D. G. Tarboton and K. R. Cooley,
(1999), "Sub-grid parameterization of
snow distribution for an energy and mass balance snow cover model", Hydrological
Processes, Hydrol. Process. 13, 1921-1933 (1999)
Williams, K. S., and D. G. Tarboton
(1999), "The ABC's of snowmelt: a
topographically factorized energy component snowmelt model", Hydrological
Processes, Hydrol.Process. 13, 1905-1920 (1999)
Adam Winstral, K. Elder and R. Davis
(1999), "Implementation of digital
terrain analysis to capture the effects of wind redistribution in spatial snow
modeling", Presented at the 67th Western Snow Conference, South Lake Tahoe, CA,
1999
G.A. McKay, and D. M.
Gray, (1982), "The distribution of
snowcover", Handbook of Snow, 'Principles, Processes, Management & Use',
1982
D. H. Male, and D. M.
Gray (1982), "Snowcover Ablatin and
Runoff", Handbook of Snow, 'Principles, Processes, Management & Use',
1982
R. J. Kind
(1982), "Snow Drifting",Handbook of Snow,
'Principles, Processes, Management & Use', 1982
Tarboton, D. G., (1997), "A New Method for the Determination of Flow
Directions and Contributing Areas in Grid Digital Elevation Models," Water
Resources Research, 33(2): 309-319.
Tarboton, D. G. (1999), "TARDEM, A suite of programs for the Analysis of
Digital Elevation Data", Dave's Webpage: http://www.engineering.usu.edu/cee/faculty/dtarb/tardem.html
Pack, R. T., D. G. Tarboton and C. N.
Goodwin, (1998), "The SINMAP Approach to
Terrain Stability Mapping," Paper Submitted to 8th Congress of the International
Association of Engineering Geology, Vancouver, British Columbia, Canada 21-25
September 1998
Dingman, S. L.,
(1994), Phisical Hydrology, Macmillan,
575 p.
Elder, K.,
(1995), "Snow Distribution in Alpine
Watersheds," Ph.D Thesis, University of California
Tarboton, D. G. (1998), "Snow Hydrology: The parameterization of subgrid
processes within a physically based snow energy and mass balance model", Project
Proposal
Jinsheng, Y,
(1999), "Data Set for Snow Hydrological
Modeling in Green Lakes Basin", Webpage: http://egl16.engr.usu.edu/giswr/youjins/Data_of_Niwot.htm
1999

<Do not
feel cold, my paper is for snow!>
If you have comments or suggestions, email me at youjins@fox.cee.usu.edu