Mapping Endangered Fish
Habitat
in the
M. Kathleen Webb
Watershed
Science Program -
GIS in Water
Resources Term Paper - Fall 2001
INDEX
Background
Objectives and Project
Overview
Data Acquisition and
Manipulation
Background
Operating a dam
in order to manage for a healthy ecosystem was unheard of before the mid-1990s. At that time the Glen Canyon Environmental
Studies (GCES) culminated in the 1996 experimental flood in
 Humpback chub, Gila cypha, is endemic to the
Objectives and Project Overview
 My project objective was to
monitor and analyze changes in the surface area of available backwater habitat
due to high flow releases from Glen Canyon Dam. Backwater habitat is
crucial for the survival of the endangered fish species Gila cypha, Humpback chub.
My study area is the
My project objective was to
monitor and analyze changes in the surface area of available backwater habitat
due to high flow releases from Glen Canyon Dam. Backwater habitat is
crucial for the survival of the endangered fish species Gila cypha, Humpback chub.
My study area is the
Study Area
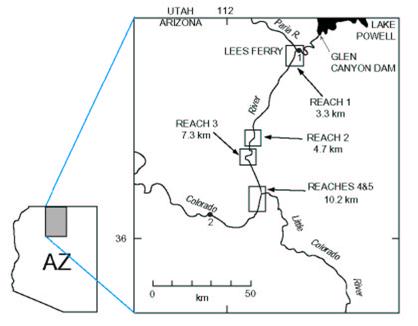 My study area included four
reaches spanning from
My study area included four
reaches spanning from
Reaches:
·
Lees Ferry = 3.3 km
·
Redwall = 4.7 km
·
Pt. Hansbrough = 7.3 km
·
LCR/Tapeats Gorge = 10.2 km
Figure 4.
Map of Study Area.
Data Acquisition and Manipulation
·
All images used in this study were obtained from the Grand Canyon
Monitoring and
·
Digital Orthoquads were available for the
pre- and post-spike images. These were
cropped to include the river corridor only, using Mr. SID.
·
Non-rectified aerial photos were available for the period during the
spike flow. Tic marks had to be added to
non-rectified images that correlated with tic marks on the rectified
images. I did this using ArcINFO. The spike
flow images were then transformed to match the pre- and post-spike orthophotos.
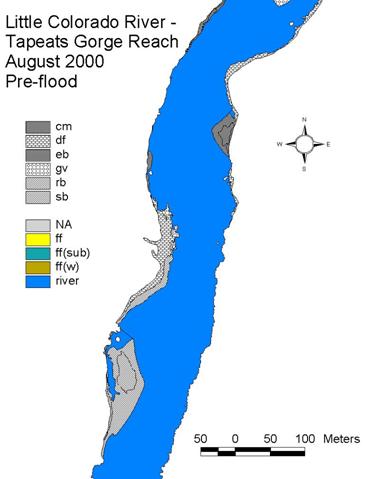
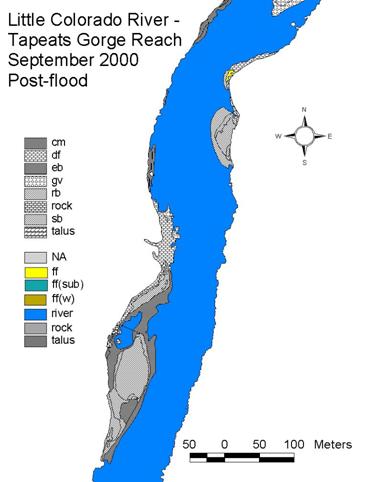
The following images are
comparison photos from before (August) and after (September) the flood. One noticeable difference between the two
sets of images is the turbidity of the water.
Before the flood, presumably due to natural sediment influx from the
For all of the newly
rectified images of the river during the spike flow, the edge of water was
digitized (on-screen) as arcs and then built into polygons that represented the
river at peak flow, using ArcINFO. These coverages
were copied and overlaid on the pre- and post-spike images, additional arcs
were digitized onto the new coverages and topology
was built (this creates polygons with attribute tables). The new polygons represented various surficial geologic features such as wet, dry, or submerged
sand deposits in eddies or along channel margins, debris fans, talus, and
mid-channel boulders. These steps are
outlined below.
Step one: Locate deposits within designated reaches
This image is of an eddy
sandbar, specifically a reattachment bar, formed by fluvial geomorphic
processes of flow and sediment transport.
The recirculating flow of an eddy below a channel constriction deposits
sand in a bar formation that is oriented in the upstream direction, and the
water remaining behind the reattachment bar is the classic backwater
habitat.
These backwaters are
characterized by slow-moving or stagnant water, warmer temperatures, large
invertebrate populations, and abundant algal growth. These characteristics are what make a
backwater area an optimal place for a larval humpback chub to drift, and then
to grow during its juvenile life.
Backwater channels provide a refuge from the fast-moving turbulent
currents of the main channel, as well as providing abundant food sources.
Step two: Digitize arcs
outlining fluvial deposits, then build them as polygons and add attributes
Once the arcs are digitized
using ArcEdit in ArcINFO
(this process is too involved to describe in detail here), the polygon topology
is built and labels are created.
In ArcTools
(within ArcINFO) the polygon coverages
are opened and each polygon is attributed with its characteristics, i.e. a
fluctuating flow (wet) reattachment bar, which indicates a low-level sandbar
deposit in the downstream end of an eddy (shown by blue arrow).
Step three: create polygons
that represent the backwater habitat area
An additional coverage is
created that includes backwater areas delineated by the boundaries of wet sand
and dry sand, represented in figure 6 by the parallel lines going from sandbar
to shore.
These newly created polygons
are attributed with labels that designate what type of deposit formed the
boundary of the backwater as well as the direction the backwater channel outlet
is oriented, i.e. upstream or downstream.
For comparison, here is the same eddy bar deposit and associated polygons
from the pre-spike images of August 2000.
The changes in configuration of the reattachment bar formation are
evident, as are the resulting changes in backwater area.
Data Analysis
·
Coverages were
opened in ArcView for viewing and to access attribute
tables
These two layouts represent a
section of the LCR-TG reach comparing August to September deposits along the
channel corridor.
· Below are two graphics of the eddy sandbar deposit in the lower portion of the above maps. They are located at the downstream end of the LCR-TG reach and demonstrate the changes in sandbar configuration after the flood.
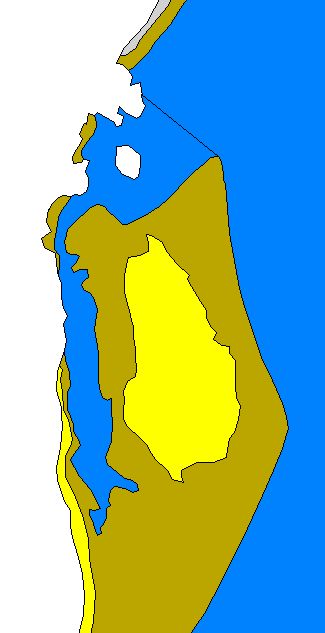
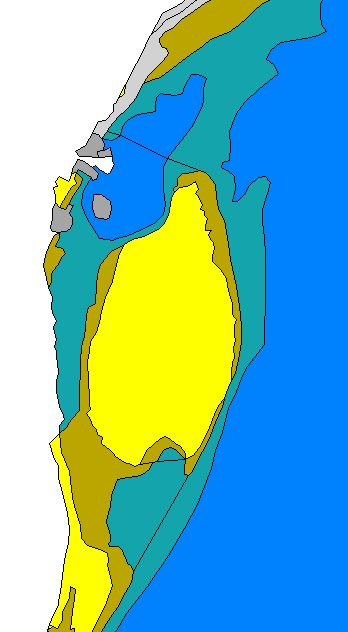
Figure 8. LCR-TG reattachment bar and backwater
area from August 2000. Figure 9. LCR-TG reattachment bar and backwater
areas from September 2000.
· Attribute tables were exported into MS Excel where pivot tables were used to calculate backwater areas.
· These pivot tables were copied to Kaleidograph for graphical representation.
The following graphs
represent change in backwater area for various backwater types, for each of the
four reaches:
a) upst drysnd
= backwaters with higher elevation sand deposits as their boundaries, opening
oriented upstream
b) upst wetsnd
= backwaters with lower elevation sand deposits as their boundaries, opening
oriented upstream
c) dwnst drysnd
= backwaters with higher elevation sand deposits as their boundaries, opening
oriented downstream
d) dwnst wetsnd
= backwaters with lower elevation sand deposits as their boundaries, opening
oriented downstream
Results
This final graph shows a
comparison in the increase of total backwater areas with sand boundaries for
each reach. This demonstrates the
longitudinal trend from upstream (Lees Ferry) to downstream (LCR-TG). Glen Canyon Dam and the
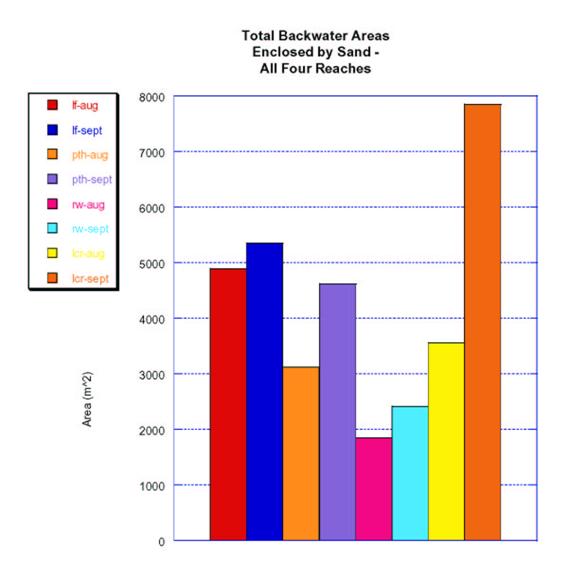
Due to the dynamic nature of channel morphology, and the range in lengths between the 4 reaches, the number of eddies varies between reaches. The greatest increase in backwater area occurred in the LCR-TG reach. Characteristics of this reach that contribute to the increase are the overall length of the reach (10.2 km, the longest of the four reaches), the confluence of the Little Colorado River being in the middle of the reach - the largest tributary to the Colorado River in Grand Canyon. The other reaches also show an increase after the flooding event, to varying degrees.
Conclusions
· Controlled floods from Glen Canyon Dam succeeded at increasing overall area of backwaters.
· The longitudinal trend is of a larger percent increase in backwater area corresponding with increasing distance from Glen Canyon Dam. This is a result of greater sediment availability due to scour of the bed and tributary inputs.
· This study included an analysis of backwater change measured immediately before and after the controlled flood. That time series does not provide information about the life span of these newly deposited and reconfigured sandbars.
· Additional research questions deal with how long the new backwater areas last under regular dam operations, whether or not juvenile humpback chub are utilizing these new backwaters to a greater extent due to the increase in overall area, and what the ecological value of the habitat is in terms of food sources, i.e. algal growth and invertebrate biomass.
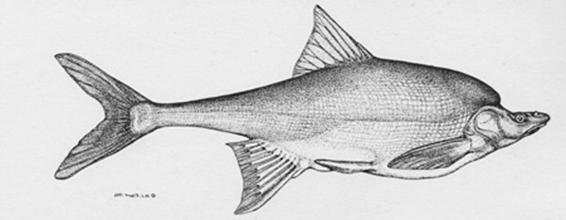
Figure 10. Humpback chub, Gila cypha.
Endangered fish species native to the
 Acknowledgements
My enormous thanks to
·
Hoda Sondossi - Department of
Geography and Earth Resources,
·
Jack Schmidt - Department of Geography and Earth Resources,
·
Matthew Wilson - Department of Romance, Home Life and Food Consumption,
References
Patten, Duncan T., David A. Harpman, Mary I. Voita, and
Timothy J. Randle. A Managed Flood on the