CEE5440/CEE6440 G I S in Water Resources
Fall Semester, 2001. August 28 - December 6.
Term Paper:
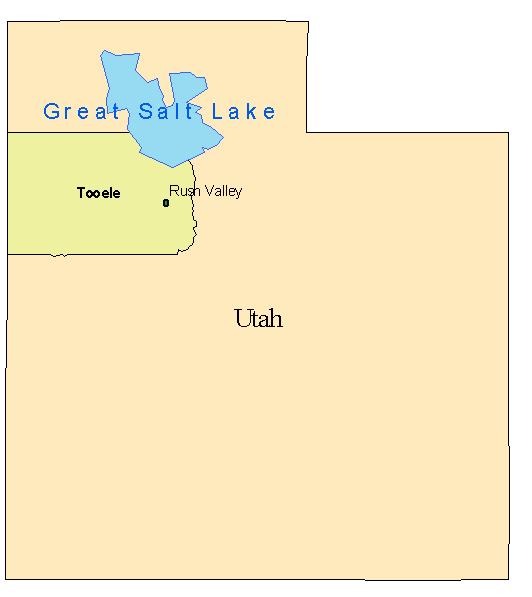
Assessing Soil Water Infiltrability
for Different Rainfall Intensities - Rush Valley, UT
Vasile Turcu
Department of Plants, Soils and Biometeorology - Utah
State University
vasile@cc.usu.edu
Introduction
 Water ressources
management is an important issue of our days, and especially in arid and
semi-arid regions, where a better estimation of water balance in soil is
crucial. One important issue is to evaluate qualitatively and quantitatively
the spatial distribution of water in the region of interest. The input
is generally the precipitation, but we need better tools to evaluate how
water redistributes itself whithin the soil surface. Soil infiltration
models are one way of dealing with this issue.
Water ressources
management is an important issue of our days, and especially in arid and
semi-arid regions, where a better estimation of water balance in soil is
crucial. One important issue is to evaluate qualitatively and quantitatively
the spatial distribution of water in the region of interest. The input
is generally the precipitation, but we need better tools to evaluate how
water redistributes itself whithin the soil surface. Soil infiltration
models are one way of dealing with this issue.
Objectives
-
Evaluate infiltrability rate, using soil survey data the types of soils
in Tooele County, and their physical characteristics;
-
Delineating the areas were rainfall intensity overcomes the infiltration
rate, therefore runoff will occur.
-
Calculate (based on simple model) soil water storage in different areas,
for a given rainfall event - focus on Rush Valley area.
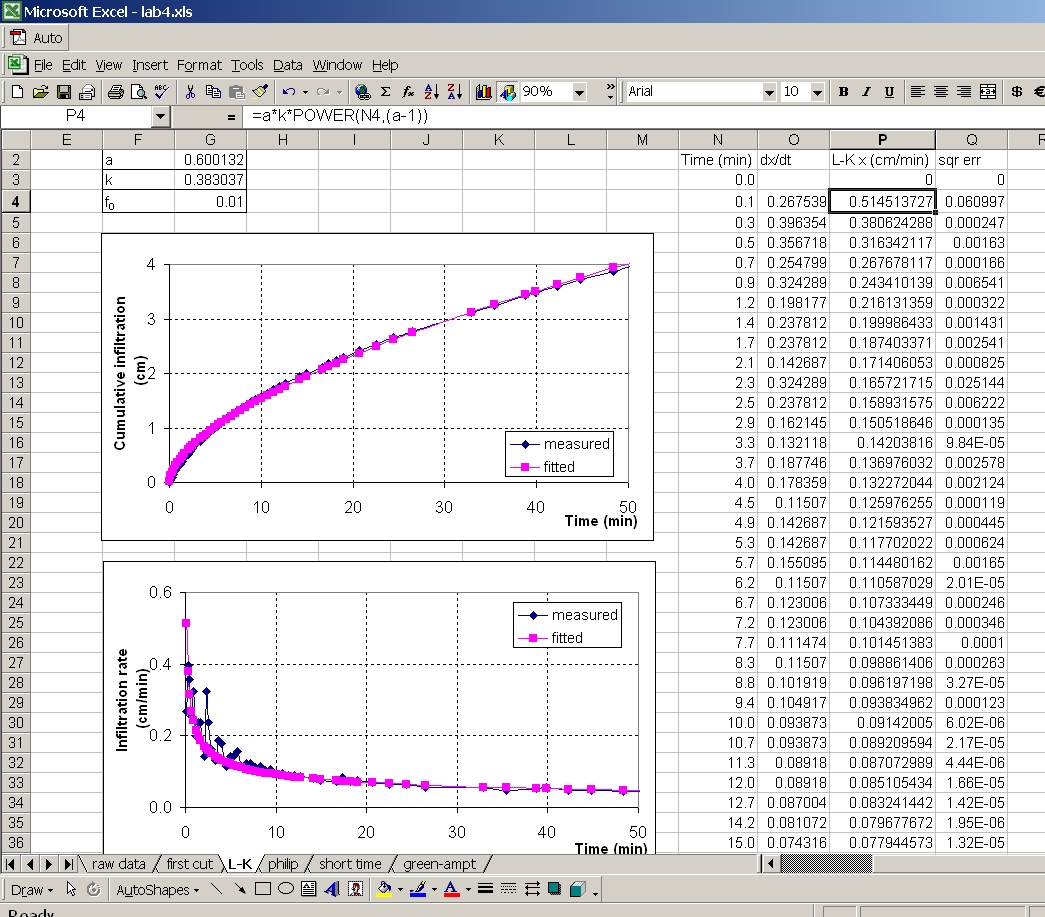
Infiltration Model
In order to evaluate the infiltration rates for water infiltration in
different types of soils, the Lewis-Kostiakov equation was used:
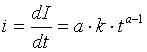 ,
,
where  is the cumulative
infiltration or the volume of water per unit soil surface area,
is the cumulative
infiltration or the volume of water per unit soil surface area,
k and a are empirical parameteres, and t is the
time elapsed from the begining of rainfall.
Parameters k and a are determined by fitting the equation
to real measurements of infiltration in different types of soil.
The main disadvantages of this equation are:
1) disregards the spatial difference in initial water content;
2) for long times, it erroneusly predicts a zero infiltration rate.
(Or and Wraith, 2000)
Both disadvantages can be neglected in the specific case of Rush Valley,
UT. General conditions during summer season are so dry that initial water
content is extremely low and doesn't vary to o much. Climate being semi-arid,
rainfalls do not last for enough long time to take into account the second
disadvantage either.
Data used and procedure
Soil data in digital format for the area was downloaded from the United
States Geological Survey (USGS) web site. Data is organized in 7.5 quadrangles
an can be added as map layer in ArcView. For the area of interest, 6 quadrangles
were used (coded in USGS classification as S4011236, S4011237, S4011238_0a,
S4011244_0a, S4011245_0a, and S4011246_0a).
Data characteristics are as follows:
Grid_Coordinate_System_Name:
Universal Transverse Mercator
Universal_Transverse_Mercator:
UTM_Zone_Number:
11
Transverse_Mercator:
Scale_Factor_at_Central_Meridian: 0.9996
Longitude_of_Central_Meridian: -117.0
Latitude_of_Projection_Origin: 0.0
False_Easting: 500000
False_Northing: 0.0
Universal_Transverse_Mercator:
UTM_Zone_Number:
12
Transverse_Mercator:
Scale_Factor_at_Central_Meridian: 0.9996
Longitude_of_Central_Meridian: -111.0
Latitude_of_Projection_Origin: 0.0
False_Easting: 500000
False_Northing: 0.0
Planar_Coordinate_Information:
Planar_Coordinate_Encoding_Method:
coordinate pair
Coordinate_Representation:
Abscissa_Resolution:
0.61
Ordinate_Resolution:
0.61
Planar_Distance_Units: meters
Geodetic_Model:
Horizontal_Datum_Name: North American
Datum of 1927
Ellipsoid_Name: Clarke 1866
Semi-major_Axis: 6378206.4
Denominator_of_Flattening_Ratio: 294.98
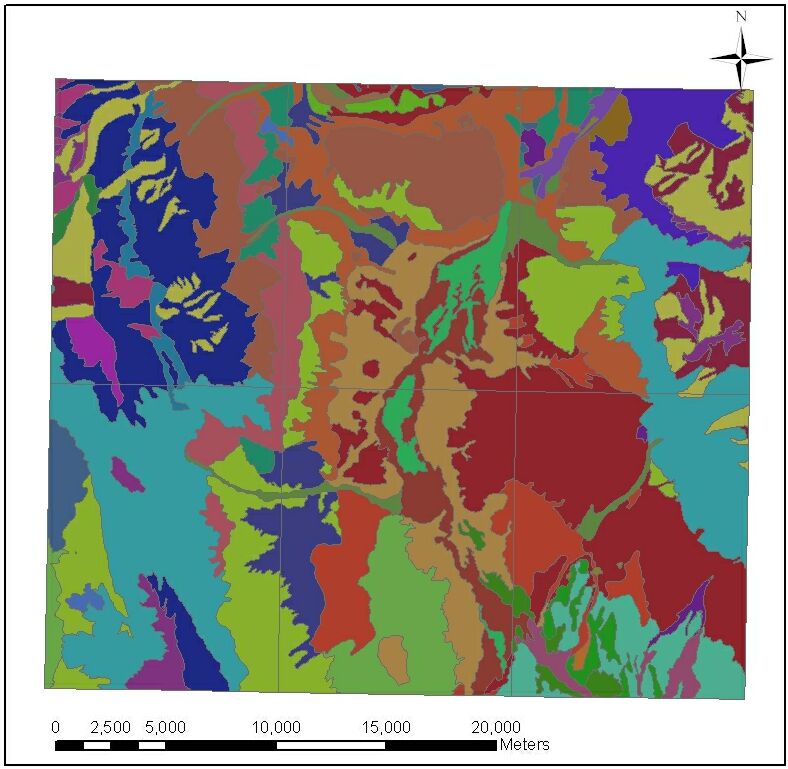
The layers were merged into a single one, called RV.lyr.
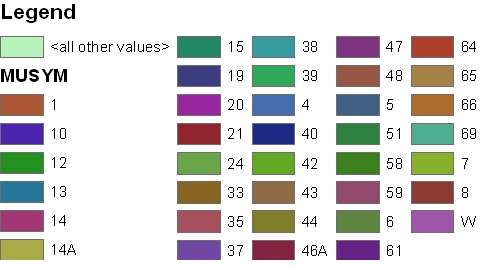
In the attribute table, the last field is MUSYM, which is a symbol
that uniquely identifies a map unit within a soil survey area. According
to this last field classification of the area, a new field called INF (from
infiltration) was added. This field contains values of infiltration rates
calculated primarly in Excel for each type of soil, using the model described
above. Based on this field, a new delineation could be done in ArcView,
considering the areas where rainfall intensity (assumed constant) overcomes
infiltration rate as regions with runoff.
The scenario includes the hypothesis of three different rainfall events:
1. Intensity: 1 mm/h; time: 2 h;
2. Intensity: 5 mm/h; time: 2h;
3. Intensity: 5 mm/h; time: 4h.
(Rainfall intensities are assumed constant in time.)
Calculations of Lewis-Kostiakov model parameters and of infiltration
rates were done in Microsoft Excel:
Results and discussion
For the first case, a raifall event with intensity of 1mm/h and a duration
of 2 hours, calculated potential infiltration rate is in between 40 to
75 mm/h (really high!) so all water from precipitation infiltrates in soil,
no matter of the soil type. No runoff occurs in this situation.
The second simulation was done for a rainfall intensity of 5 mm/h,
during a 2 hours period. In this case, calculated infiltrability ranges
from 7.5 to 13 mm/h.
Regions in blue, are the regions where there is runoff: a) for 2 hours
and b) for 4 hours.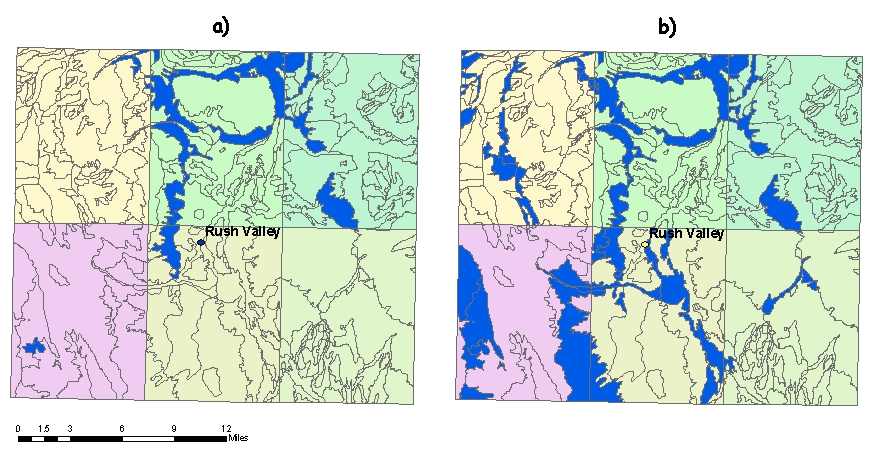
One can see the expected extension of surfaces where runoff occurs.
Next steps for future work could be to evaluate it quantitatively and integrate
the total volume of water that accumulates from one region with runoff
to its adjacent regions. This will be important for the global and local
water balance in soil, as well for calculating soil water availability
for plants. As more data is available, the model shoud be improved and
take into account evapotranspiration, land coverage, slope, etc.
Conclusions
-
Simple infiltration model can be used to delineate the regions where runoff
occurs in different weather conditions scenarios.
-
GIS tools are useful to evaluate water availability for plants in different
climatic conditions, by simple computer simulations.
-
The model can be improved by introducing more constraints in the water
flow processes (lateral flow, plants uptake etc.)
References
- Or D., and Wraith, J.M., 1994. Agricultural and Environmental
Soil Physics (classnotes).
- Zeiler, M., 1999. Modeling Our World - ESRI Press.