Term Project --- GIS in
Water Resources
Estimating
Life Loss Resulting from Dam Break
with
GIS
by Yibing ZHU
Fall,
2000
Utah State
University
--------------------------------------------------------------------------------------------------------------------------
Table of
Contents
1. Goals, Topic and Project Location
2. Background (about Life Loss Resulting from Dam Break)
3. About Data (Flood, Geographic & Census Data)
4. Processing
5. Future Work
6. References and Thanks
--------------------------------------------------------------------------------------------------------------------------
1.
Goals, Topic and Project Location
The goals of this term project is to become familiar with some part of GIS, and to experience GIS method in a simple life loss estimation for future research in same field.
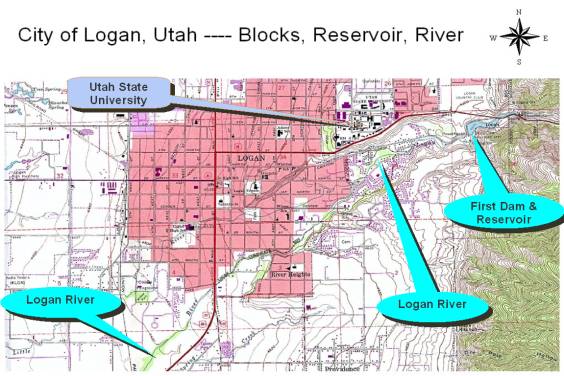
The project location is at City of Logan, Utah, which is also home to Utah State University. Logan River runs out of Logan Canyon and crosses through the southeast part of Logan City. There is a little dam called First Dam stands on the river at the outlet of the canyon. Logan City below the dam. http://www.lib.utexas.edu/Libs/PCL/Map_collection/united_states/Logan_Ut_86.jpg
2.
Background on Life Loss Resulting from Dam Break
Estimating life loss resulting from dam break is an important part in Dam Safety Risk Assessment and Management, which studies the possibility and consequence of dam failure, and provides the basis for management decision.
Life loss is events with chance. Various factors influence Population at risk (Par) and further life loss:
Flood severity (depth, velocity);
Warning time;
Evacuation;
Weather;
Time of day, day of week, and time of year;
Cause and type of dam failure;
Activity in which people are engaged;
Individual physical condition;
Building structure, vegetation, topography;
And so on.
The main research methods in estimating life loss are:
- Regression analysis with historic failure data set;
- Tracking individuals, and simulating, judging whether they could reach safe zone or not. It is perfect in theory and logic, but complex, not easy to understanding, and expensive.
- Between a. and b..
Life loss estimation could be divided into two main successive parts:
- Statisticing (Counting) Population at risk (Par), and dividing the Par into homogeneous subPars. This part is the basis for the next part, and is more suitable to apply GIS method efficiently.
- Life loss analyzing and calculating.
In this term project, I work with Graham Model (1999), which is an empirical guidance using flood severity based method for estimating life loss, because life loss is caused mainly by flood dynamics. Graham Model (1999) is a brief model, just considering 15 conditions derived from flood severity, warning time, and flood severity understanding (The three dominant factors that influenced life loss). U.S. Bureau of Reclamation adopts it as present standard. Because the flood severity is first-level factor which controls the overall extent of life loss, so I omit the other two factors to simplify Graham Model for this exercise. (Same estimation method for other conditions).
Simplified Graham Guidance
Flood Severity Level |
Judgment for Level |
Fatality Rate |
|
High |
D*V>600 (ft2/s) |
0.75 |
|
Medium |
|
0.15 |
|
Low |
D*V<50 (ft2/s) |
0.01 |
D---The max flood depth at a cross section.
V---The max flood velocity at a cross section.
3. About
Data (Flood, Geographic & Census Data)
Life loss research involves flood data, geographic data and census data.
The flood data come from DAMBRK Model (National Weather
Service). It gives inundation coverage and flood severity data (maximum depth
and maximum velocity at downstream cross sections).
Unfortunately, I don’t find out Logan City’s geographic and census data in GIS form for this term project, so I need to create them. The data I create base on the following information.
Census Bureau provides two
kinds of data about census separately. Tiger (Topologically Integrated
Geographic Encoding and Referencing) consists of geographic data at tract level,
while Census data gives population information at block level. An average of
five blocks make up one tract, therefore data at block level is the greatest
detailed information by now. Usually, TIGER files (TIGER/Line, the public
product extracted from TIGER) are free to public, and Census data need charge.
From census data, could get .dbf (dBASE) file; and from TIGER file, could get polygon coverage. To join census data to TIGER data, I could get shape theme including demographic data at the block level. (Theme/Convert to Shape File)
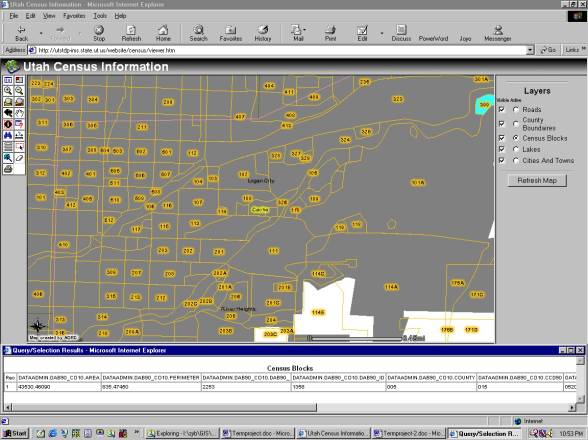
Below is part of the census blocks of
Logan City. (http://utstdp-ims.state.ut.us/website/census/viewer.htm).
It is very similar to city block. So I could create the census blocks according
to the city blocks in this exercise.
I learn these from Census Bureau documents and Michele Simpson. Michele Simpson describes a method to join census information to TIGER data in order to display census data at block level, in her/his term project in Spring 1998, University of Texas at Austin.
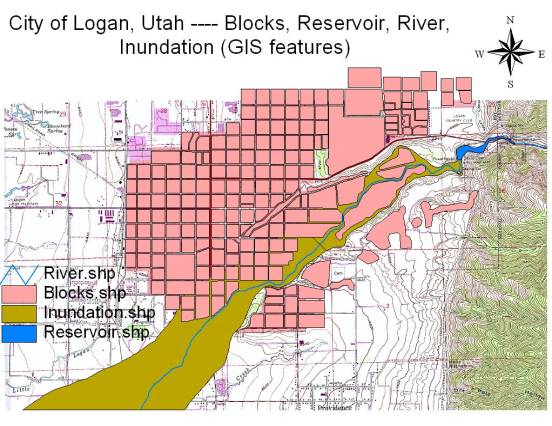
The main data I need for this term project are:
A. City blocks with census information
B. Inundation coverage
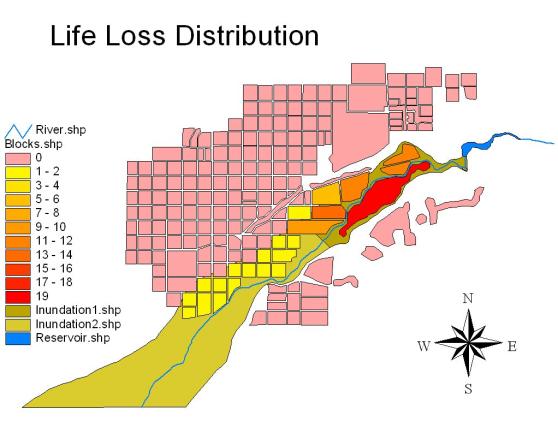
Following layout shows the GIS theme features I create, and their attributes tables.
The procedure of creating features:
1. Import Logan map as background to create features:
File/Extensions, select JPEG(JFIF) Image Support, and click OK.
Click on Add Theme button![]() , select Data Source Types as Image Data
Source, and select logan_ut_86.jpg, and press OK. Click on the
raised box to the left of the theme to make a check mark to see the coverage
displayed in the View window. Click on the Save Project button
, select Data Source Types as Image Data
Source, and select logan_ut_86.jpg, and press OK. Click on the
raised box to the left of the theme to make a check mark to see the coverage
displayed in the View window. Click on the Save Project button![]() to save this
project as Termproj.apr.
to save this
project as Termproj.apr.
2. Create River.shp: View/New Theme,
select Feature type as Line, press OK, and save the new
theme named River.shp in the work directory. Double click
River.shp legend to open Legend Editor, and double click
Symbol to change Color to light blue, to change Pen size to
2. Click on Apply in Legend Editor window. Hit Draw Line button![]() , and click along the river line of logan_ut_86.jpg to create
river feature, double click at the end point. If River.shp not active, first
click on it’s legend, and select Theme/Start Editing to edit features. In
the condition of Start Editing, I adjust the vertex position of the line by hit
Vertex Edit button
, and click along the river line of logan_ut_86.jpg to create
river feature, double click at the end point. If River.shp not active, first
click on it’s legend, and select Theme/Start Editing to edit features. In
the condition of Start Editing, I adjust the vertex position of the line by hit
Vertex Edit button![]() . Select Theme/Stop Editing to quit, response to
Yes to save edits to River.shp. Click on Clear Selected
Features button
. Select Theme/Stop Editing to quit, response to
Yes to save edits to River.shp. Click on Clear Selected
Features button![]() .
.
3. Create Reservoir.shp: View/New Theme,
select Feature type as Polygon, press OK, and save the new
theme named Reservoir.shp in the work directory. Double click on
Reservoir.shp legend to open Legend Editor, and double click
Symbol to change Color to dark blue. Click on Apply in
Legend Editor window. Using Zoom In button![]() to have a closer
look. Using Pan button
to have a closer
look. Using Pan button![]() to move the
display. Hit Draw Polygon button
to move the
display. Hit Draw Polygon button![]() , and click along the reservoir’s shoreline of
logan_ut_86.jpg to create reservoir feature, double click at the end point.
Click on Vertex Edit button
, and click along the reservoir’s shoreline of
logan_ut_86.jpg to create reservoir feature, double click at the end point.
Click on Vertex Edit button![]() to adjust the
vertex position of the polygon. Select Theme/Stop Editing to quit, and
response to Yes to save edits to Reservoir.shp. Click on Clear
Selected Features button
to adjust the
vertex position of the polygon. Select Theme/Stop Editing to quit, and
response to Yes to save edits to Reservoir.shp. Click on Clear
Selected Features button![]() .
.
4. Create Blocks.shp: View/New Theme,
select Feature type as Polygon, press OK, and save the new
theme named Blocks.shp in the work directory. Double click on
Blocks.shp legend to open Legend Editor, and double click
Symbol to change Color to pink. Click on Apply in Legend
Editor window. Hit Draw Polygon button![]() or Draw
Rectangle
button
or Draw
Rectangle
button![]() , and click along the block’s outline of logan_ut_86.jpg to
create block features block by block. Click on Vertex Edit button
, and click along the block’s outline of logan_ut_86.jpg to
create block features block by block. Click on Vertex Edit button![]() to adjust the
vertex position of the blocks. Select Theme/Stop Editing to quit, and
response to Yes to save edits to Blocks.shp. Click on Clear
Selected Features button
to adjust the
vertex position of the blocks. Select Theme/Stop Editing to quit, and
response to Yes to save edits to Blocks.shp. Click on Clear
Selected Features button![]() .
.
5. Create Inundation.shp: View/New
Theme, select Feature type as Polygon, press OK, and
save the new theme named Inundation.shp in the work directory. Double
click on Inundation.shp legend to open Legend Editor, and double
click Symbol to change Color to green-yellow. Click on
Apply in Legend Editor window. Hit Draw Polygon button![]() , and click according to the inundation map in reference 2 to
roughly create inundation feature, double click at the end point. Click on
Vertex Edit button
, and click according to the inundation map in reference 2 to
roughly create inundation feature, double click at the end point. Click on
Vertex Edit button![]() to adjust the
vertex position of the polygon. Select Theme/Stop Editing to quit, and
response to Yes to save edits to Inundation.shp. Click on Clear
Selected Features button
to adjust the
vertex position of the polygon. Select Theme/Stop Editing to quit, and
response to Yes to save edits to Inundation.shp. Click on Clear
Selected Features button![]() .
.
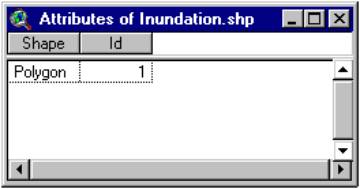
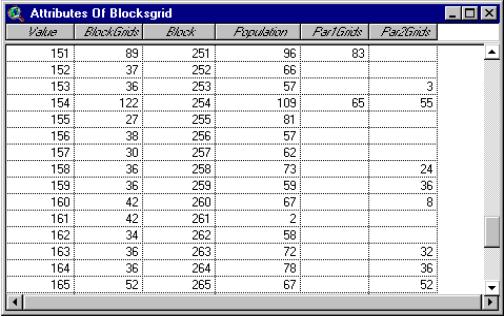
6. Click on Blocks.shp theme legend, and hit
Open Theme Table button![]() to open
Attributes of Blocks.shp. Click on Inundation.shp theme legend,
and hit Open Theme Table button
to open
Attributes of Blocks.shp. Click on Inundation.shp theme legend,
and hit Open Theme Table button![]() to open
Attributes of Inundation.shp.
to open
Attributes of Inundation.shp.
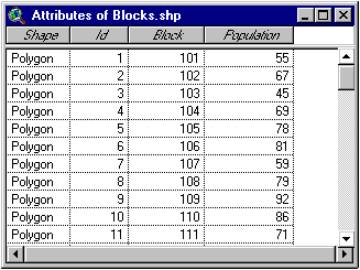
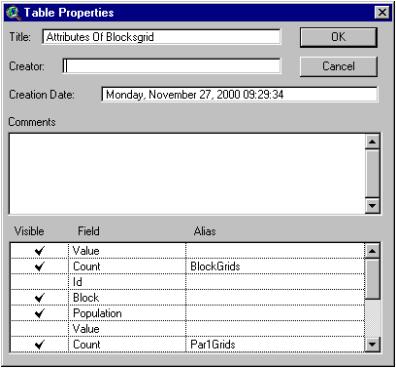
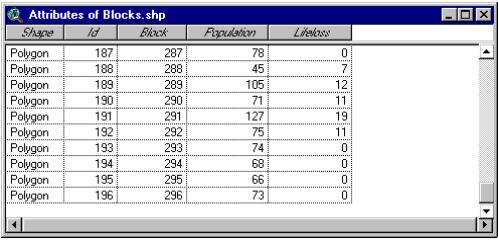
With Attributes of Blocks.shp open, to make it active by
clicking on it, Table/Start Editing, and Edit/Add Field to open
Field Definition window, give Block in Name, Number
in Type, 10 in Width, and 0 in Decimal
Places, then press OK. Thus Block field add into the table.
Same procedure for adding Population field. Hit Edit
button![]() to add values in
Id field, Block field, and Population field. The values of
Block and Population are assumed, the values of Id in
order. Table/Stop Editing, response to Yes to save edits.
to add values in
Id field, Block field, and Population field. The values of
Block and Population are assumed, the values of Id in
order. Table/Stop Editing, response to Yes to save edits.
Make Attributes of Inundation.shp active by clicking
on it, Table/Start Editing, Hit Edit button![]() to change the
value in Id field from 0 to 1. Table/Stop Editing, response to
Yes to save edits.
to change the
value in Id field from 0 to 1. Table/Stop Editing, response to
Yes to save edits.
4.
Processing
From above layout, could see that, the flood will endanger the blocks covered or cut by the inundation area. So the question is that how I cut these blocks from all, and get Population at risk (Par) in blocks, and further to calculate life loss.
Map Calculator is a useful tool in this process. It could help to get the overlap of themes. Map Calculator works with grid data, so I need to convert shape themes to grid themes.
First step is flood severity calculating and zoning the inundation area on flood severity level. The basic flood data come from DAMBRK Model. Calculating and graphing in Excel.
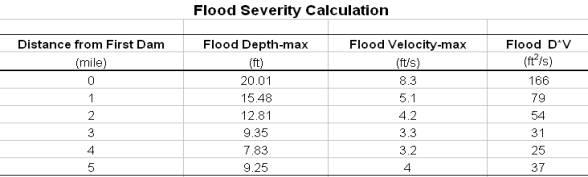
From above flood severity curve and Graham Model, could know that there are two flood severity level zones in this case. They are separated at 2.15 miles downstream from First Dam. Because DAMBRK is a one dimensional model, so I just could divide flood severity zones along the river, couldn’t parallel the river.
Dividing the inundation.shp theme into two parts at the place
2.15 miles downstream from First Dam. Show below. The process: Make
Inundation.shp active by clicking on it’s legend, Theme/Start
Editing, and then hit Draw
Line to Split Polygon button![]() to divide
Inundation.shp to two parts. Theme/Stop Editing, response to
Yes to save edits to Inundation.shp. Click on Clear
Selected Features button
to divide
Inundation.shp to two parts. Theme/Stop Editing, response to
Yes to save edits to Inundation.shp. Click on Clear
Selected Features button![]() . Click on Select Feature button
. Click on Select Feature button![]() , and click on the up-right part of Inundation.shp to
make it highlighted, Theme/Convert to Shapefile, save the new theme named
Inundation1.shp in the work directory, and response to Yes to add
Inundation1.shp theme to the view. Double click on the legend of
Inundation1.shp to open it’s Legend Editor, double click
Symbol, and change Color to dark green-yellow. Click on
Apply in Legend Editor window. Same procedure to convert the
low-left part of Inundaion.shp to a new shape file named Inundation2.shp
with legend’s color light green-yellow.
, and click on the up-right part of Inundation.shp to
make it highlighted, Theme/Convert to Shapefile, save the new theme named
Inundation1.shp in the work directory, and response to Yes to add
Inundation1.shp theme to the view. Double click on the legend of
Inundation1.shp to open it’s Legend Editor, double click
Symbol, and change Color to dark green-yellow. Click on
Apply in Legend Editor window. Same procedure to convert the
low-left part of Inundaion.shp to a new shape file named Inundation2.shp
with legend’s color light green-yellow.
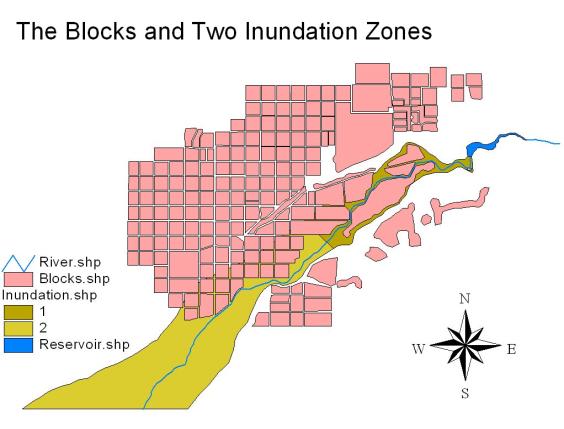
The up-right part is medium flood severity zone with fatality rate of 0.15, and the low-left part low flood severity zone with fatality rate 0.01.
Because Map Calculator works with grid data, so I need to convert shape themes to grid themes. This converting deals with Blocks.shp, Inundaion1.shp, and Inundation2.shp.
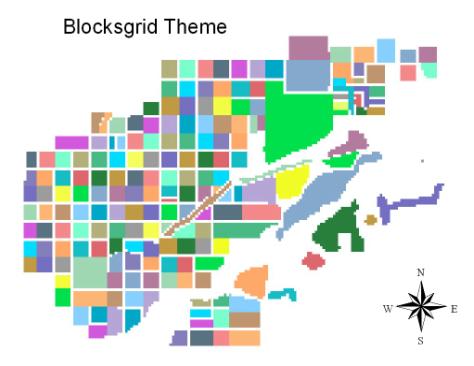
Make Blocks.shp active, Theme/Convert to Grid, save the new grid theme named Blocksgrid in the work directory. Response to Conversion Extent: Blocks.shp and Conversion Field: Blocks.shp windows as follows,
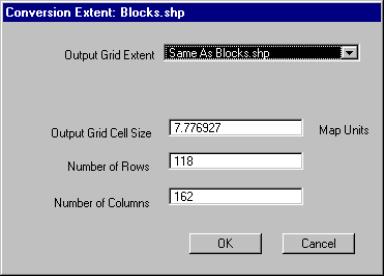
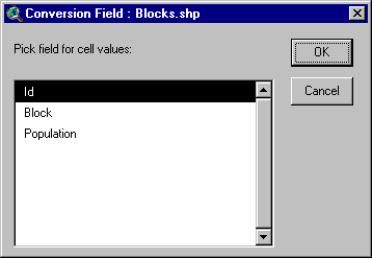
and response to Yes to Join feature attributes to grid, response to Yes to add Blocksgrid grid theme to the view. The zigzag shape shows the grids.
Make Inundation1.shp active, Theme/Convert to Grid, save the new grid theme named Inunda1grid in the work directory. Response to Conversion Extent: Inundation1.shp and Conversion Field: Inundation1.shp windows as follows,
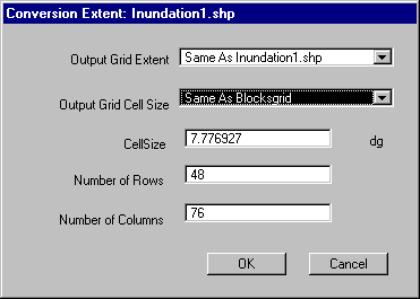
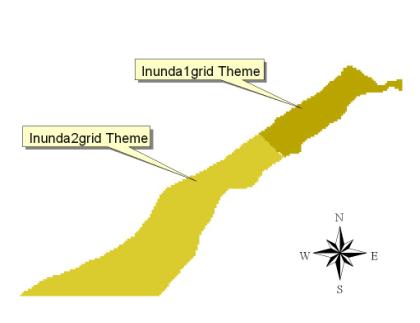
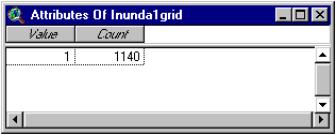
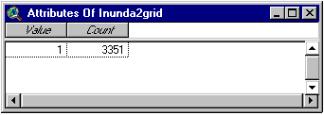
and response to Yes to Join feature attributes to grid, response to Yes to add Inunda1grid grid theme to the view. Same procedure as Inundation1.shp to convert Inundation2.shp to a grid theme named Inunda2grid.
{Notice: Don’t change the value of 1 to other values in the Value field of Attributes of Inundation2.shp or Inundation1.shp, otherwise, the value (represents block’s number) of Value in Map Calculation2:[Blocksgrid]*[Inunda2grid] or Map Calculation1:[Blocksgrid]*[Inunda1grid] will be multiplied by the values not equals 1, and the block’s number will be mixed up.}
Now, I could get the blocks within inundation area using Map Calculator: Analysis/Map Calculator, input algorithm [Blocksgrid]*[Inunda1grid] and click on Evaluate.
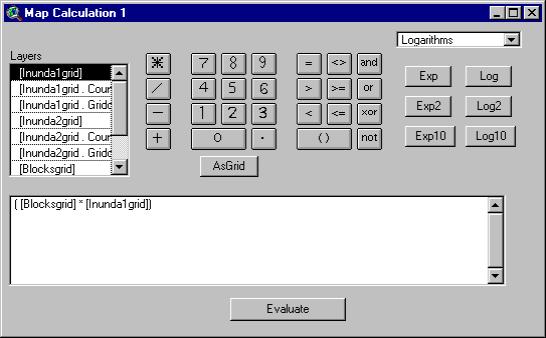
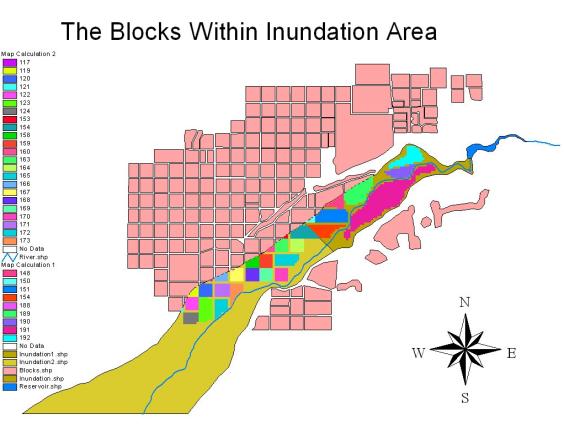
A new theme named Map Calculation1 is created, and add to the view automatically. Analysis/Map Calculator again, input algorithm [Blocksgrid]*[Inunda2grid] and click on Evaluate. A new theme named Map Calculation2 is created, and add to the view automatically. Click on the raised box to the left of Map Calculation1 and Map Calculation2 themes. The colorful blocks show the blocks within inundation zone 1 and 2 respectively.
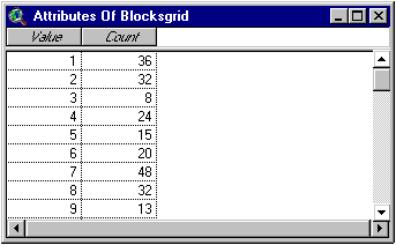
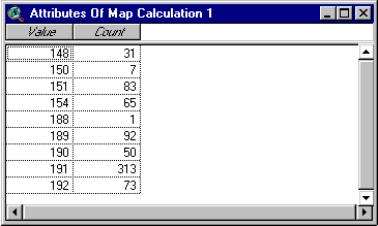
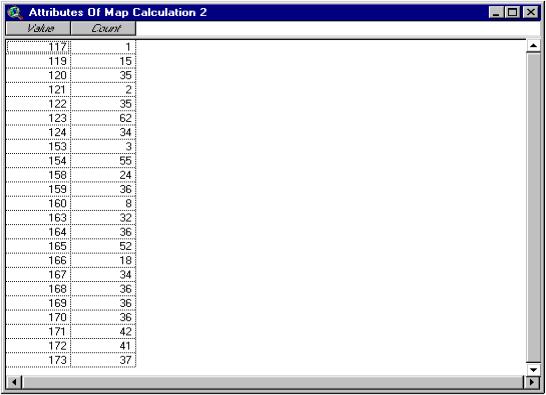
Click on the legend of Map Calculation1, and then the![]() to open
Attributes of Map Calculation1. Same procedure for opening Attributes
of Map Calculation2. In these two tables, the Count field shows the
block’s grid cell number within inundation zone1 and zone2 respectively.
to open
Attributes of Map Calculation1. Same procedure for opening Attributes
of Map Calculation2. In these two tables, the Count field shows the
block’s grid cell number within inundation zone1 and zone2 respectively.
I need a composite table for life loss calculating. It should include the fields of block’s identity number, block’s population, block’s entire grid cell number, block’s grid cell number within inundation area. Following is the joining procedure.
Open Attributes of Map Calculation1 and Attributes of Blocksgrid from Tables in project window. Click on the Value field in Attributes of Map Calculation1 at first, and then in Attributes of Blocksgrid, choose Table/Join. Then, join Attributes of Map Calculation2 to Attributes of Blocksgrid, same procedure as above.
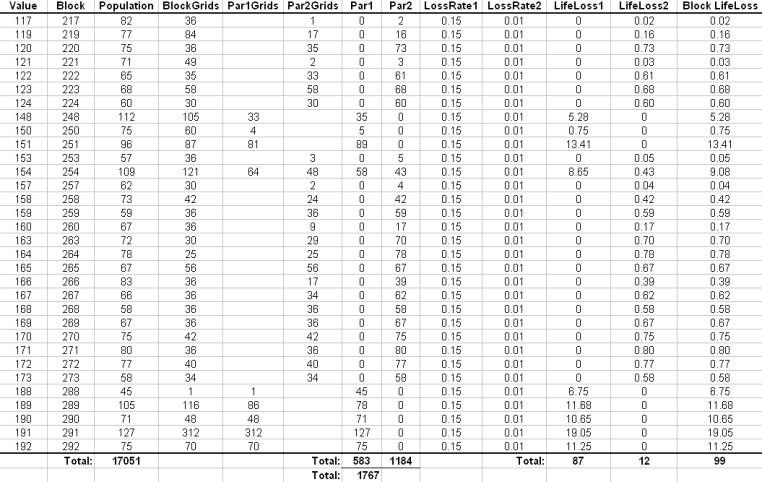
The composite table after joining:
Make Attributes of Blocksgrid active, and File/Export it to a dBASE file, named Par-Lifeloss.dbf.
Open Par-Lifeloss.dbf in Excel to calculate Population at risk (Par) and life loss.
Par (in a block) = (Block’s grid cell number within inundation area / Block’s entire grid cell number) * Block’s population
Life loss (in a block) = Par (in a block) * Fatality rate
Bring the number of life loss into Attributes of Blocks.shp for showing life loss distribution in GIS interface. Click Tables in project window, click on Add, set file type as dBASE, select Par-Lifeloss.dbf file. Open Par-Lifeloss.dbf and Attributes of Blocks.shp. Click Block field in Par-Lifeloss.dbf first, and then in Attributes of Blocks.shp, select Table/Join.
To show life loss distribution in Blocks.shp theme. Double click Blocks.shp legend, set Legend Type as Graduated Color, set Classification Field as Lifeloss, set Color Ramps as Yellow to Orange to Red, and click on Apply. Now, the Blocks.shp shows the life loss (in blocks).
5.
Future Work
¾
About DAMBRK Model
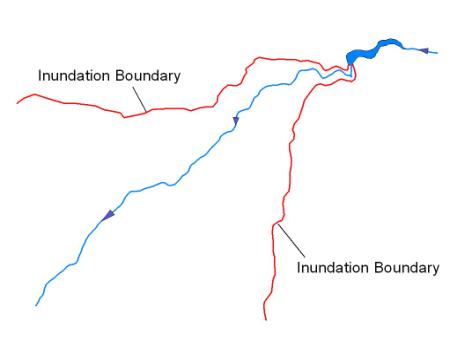
DAMBRK is a one dimensional model, it works well in valleys narrow or cross section profiles well defined, usually in mountainous regions. However, in areas that open into large, unconfined valleys, a one dimensional modeling approach fails to adequately describe the two dimensional flows. Obviously, in following graph, the flood severity along the river centerline is larger than the one near inundation area boundary.
DAMBRK Model gives the flood level and the average velocity (or maximum?) of the calculating section. With the flood level and topography, could get the point depth allover inundation area, but the velocity could not be figured out accurately.
U.S. Bureau of Reclamation has been developing a fully integrated GIS interface to DAMBRK Model. And plan to adopt a two dimensional model (MIKE21). Probably I could use this resource.
¾
About dividing Par to subPars
In a proposed life loss estimation model under development, the procedure of dividing Par is more complex and reasonable than this term project. Below shows the concept model in dividing Par to homogeneous subPars.
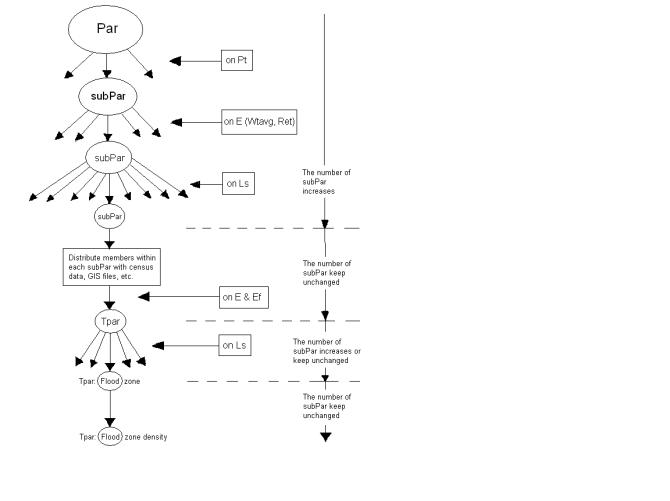
More or less of the arrow on the left side shows the number of subPars; the size of the ovals shows the area of subPars. How to realize it with GIS method is a challenge.
¾
About GIS data
In preparing this term project, I browse some websites, which include (Utah)Governors Office of Planning and Budget, State of Utah – Division of Information Technology Services, U.S. Census Bureau, USGS, Center for International Earth Science Information Network and so on, in which the last (CIESIN) seems could provide the data I need, but it’s data is unavailable now (It’s staff told me “we are having ongoing difficulties with ddcarto directory, problems may not be resolved for several days or even weeks).
6.
References and Thanks
- Michele Simpson, “GIS Analysis of Census Data and Health Care Facilities in Cameron and Hidalgo Counties, Texas”, GIS in Water Resource term project, University of Texas at Austin, Spring 1998.
- “Logan First Dam and Reservoir and Logan Third Dam and Reservoir, Cache County, Utah: Flood Inundation Study for Emergency Action Plans”, Utah Water Research Laboratory, Utah State University, RAC Engineers and Economists, May 11, 1994
- Wayne J. Graham, “A Procedure for Estimating Loss of Life Caused by Dam Failure”, Dam Safety Office, Bureau of Reclamation, U.S. Department of Interior, September 1999
- Duane M. McClelland and David S. Bowles, “A Proposed Life-Loss Estimation Model Under Development”, Institute for Dam Safety Risk Management, April 2000.
- Michael Sebhat and Tom Heinzer, “The Development of an ARC/INFO Interface to the National Weather Service DAMBRK Model”