Estimation of Evapotranspiration
in the State of Utah
by
Shujun Li
Civil and Environmental Engineering
Utah State University
December, 2000
------------------------------------------------------------------------------------------------------
Contents
Water use estimate is of importance for planning and managing water resources, particularly in arid and semiarid areas such as the state of Utah. The US Geological Survey(USGS) has a regular estimate and report on state-wide water use at five-year intervals. Recently, water use estimate on annual basis becomes practical need. But the approaches used by USGS (conventionally a variety of inventory and census-type approaches) are labor intensive. So, better methods of data collection and analysis need to be provided to make the estimate more effective and accurate. Then a research project, GIS-based state-wide water use estimate, is proposed by Utah Water Research Laboratory. In this project evapotranspiration estimate plays an important role and estimating the evapotranspiration accurately is an essential work to be done in water use estimate for the whole state. So providing a more effective method for estimating the evapotranspiration first may provide a reasonable way for the whole project. Because of the obvious feature of spatial distribution of ET, the integration of GIS into the estimate of ET would be of great value. Via GIS we can get a large quantity of electronically available data about the land use information and other types of information which may be required by the formulae for ET estimate. So, this term project is a part of an on-going research project.
The objective of this term project is to formularize and develop a more effective method for evapotranspiration estimate for the State of Utah.
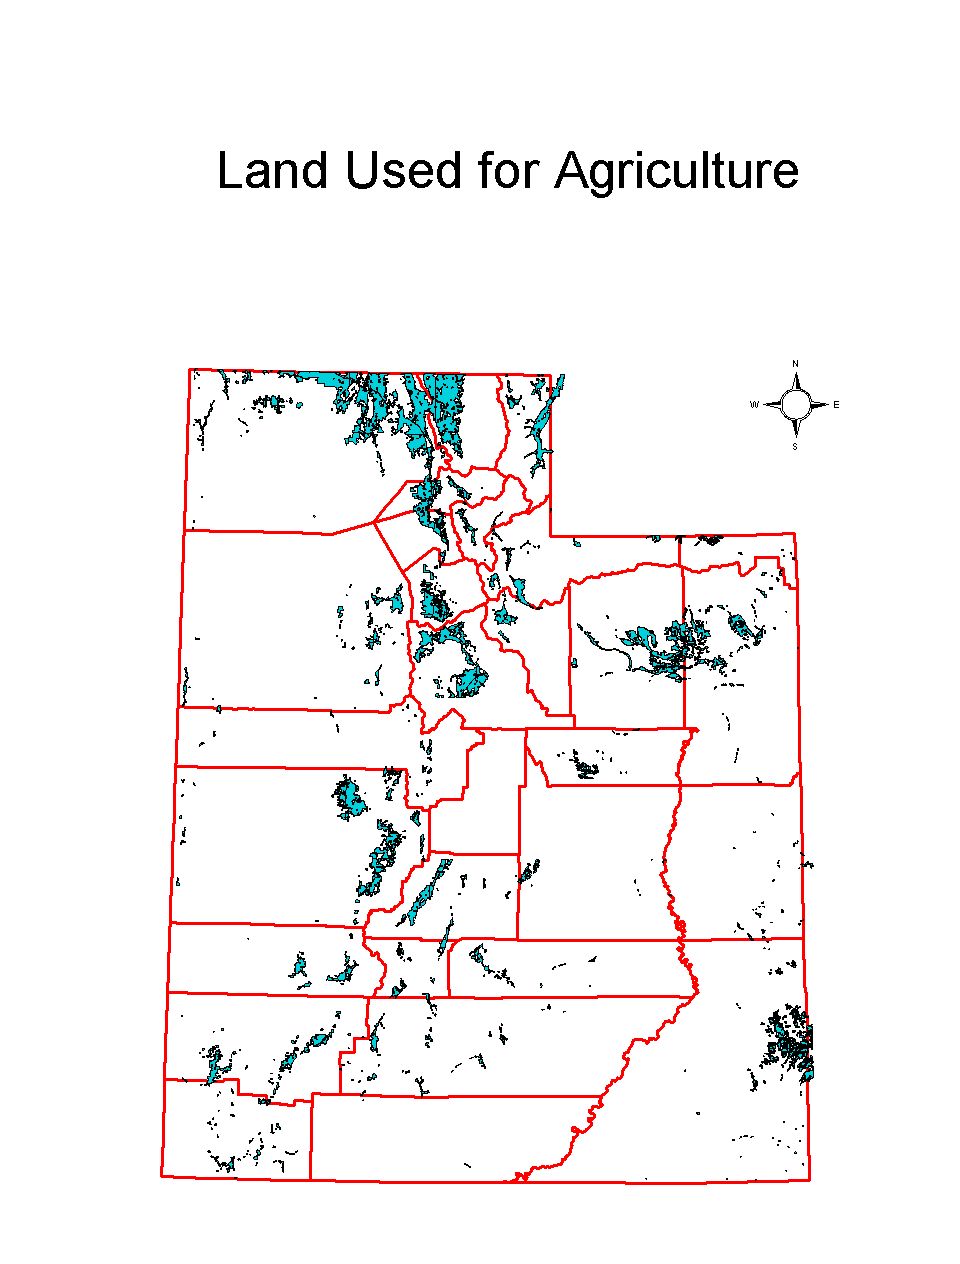
To keep consistent with the original research project, the extent of the studied region is the whole state of Utah. In this term project ET estimate is the main issue to be concerned, so the specific study area is the agriculture areas (see Fig.01)in the state of Utah.
Fig. 01 Study Area: Agriculture land
Based on SCS Blaney-Criddle equation
A few equations can be used to estimate evapotranspiration and it should be based on the data availability to decide the specific approach to be selected. considering the limited meteorological data information, the SCS Modified Blaney-Criddle Equation is for this term project. Following is the Blaney-Criddle Equation:

Where
![]()
![]() is climatic coefficient
,and
is climatic coefficient
,and ![]()
![]() is mean monthly
temperature, oF
is mean monthly
temperature, oF
![]() is percentage of daylight
hours of the year occurring during a particular month
is percentage of daylight
hours of the year occurring during a particular month
Using ArcView, Spatial Analyst, Geo-Processing
ArcView and it's Extensions could provide us effective tools to get spatial distribution information, to process spatial data, to visualize the calculation result.
The data used in this term project are obtained from a few sources. GIS data is downloaded from the website of Environmental Protection Agency(EPA BASIN).
While meteorological data is downloaded from the website of Utah Climatology (Utah Climatology). I also get some data like Crop Coefficient curve from some research report[1].

Fig. 02 Land Cover/Use Information
Above Land Use Coverage contains land cover information in the form of land use code based on which the crop coefficients can be decided. Also it give areas of each land lot to calculate total quantity of ET.
Tab. 01 Land Use Code and Explanation of Code
|
Code ( lucode) |
Explanation ( level2) |
|
21 |
CROPLAND AND PASTURE |
|
22 |
ORCH,GROV,VNYRD,NURS,ORN |
|
23 |
CONFINED FEEDING OPS |
|
24 |
OTHER AGRICULTURAL LAND |
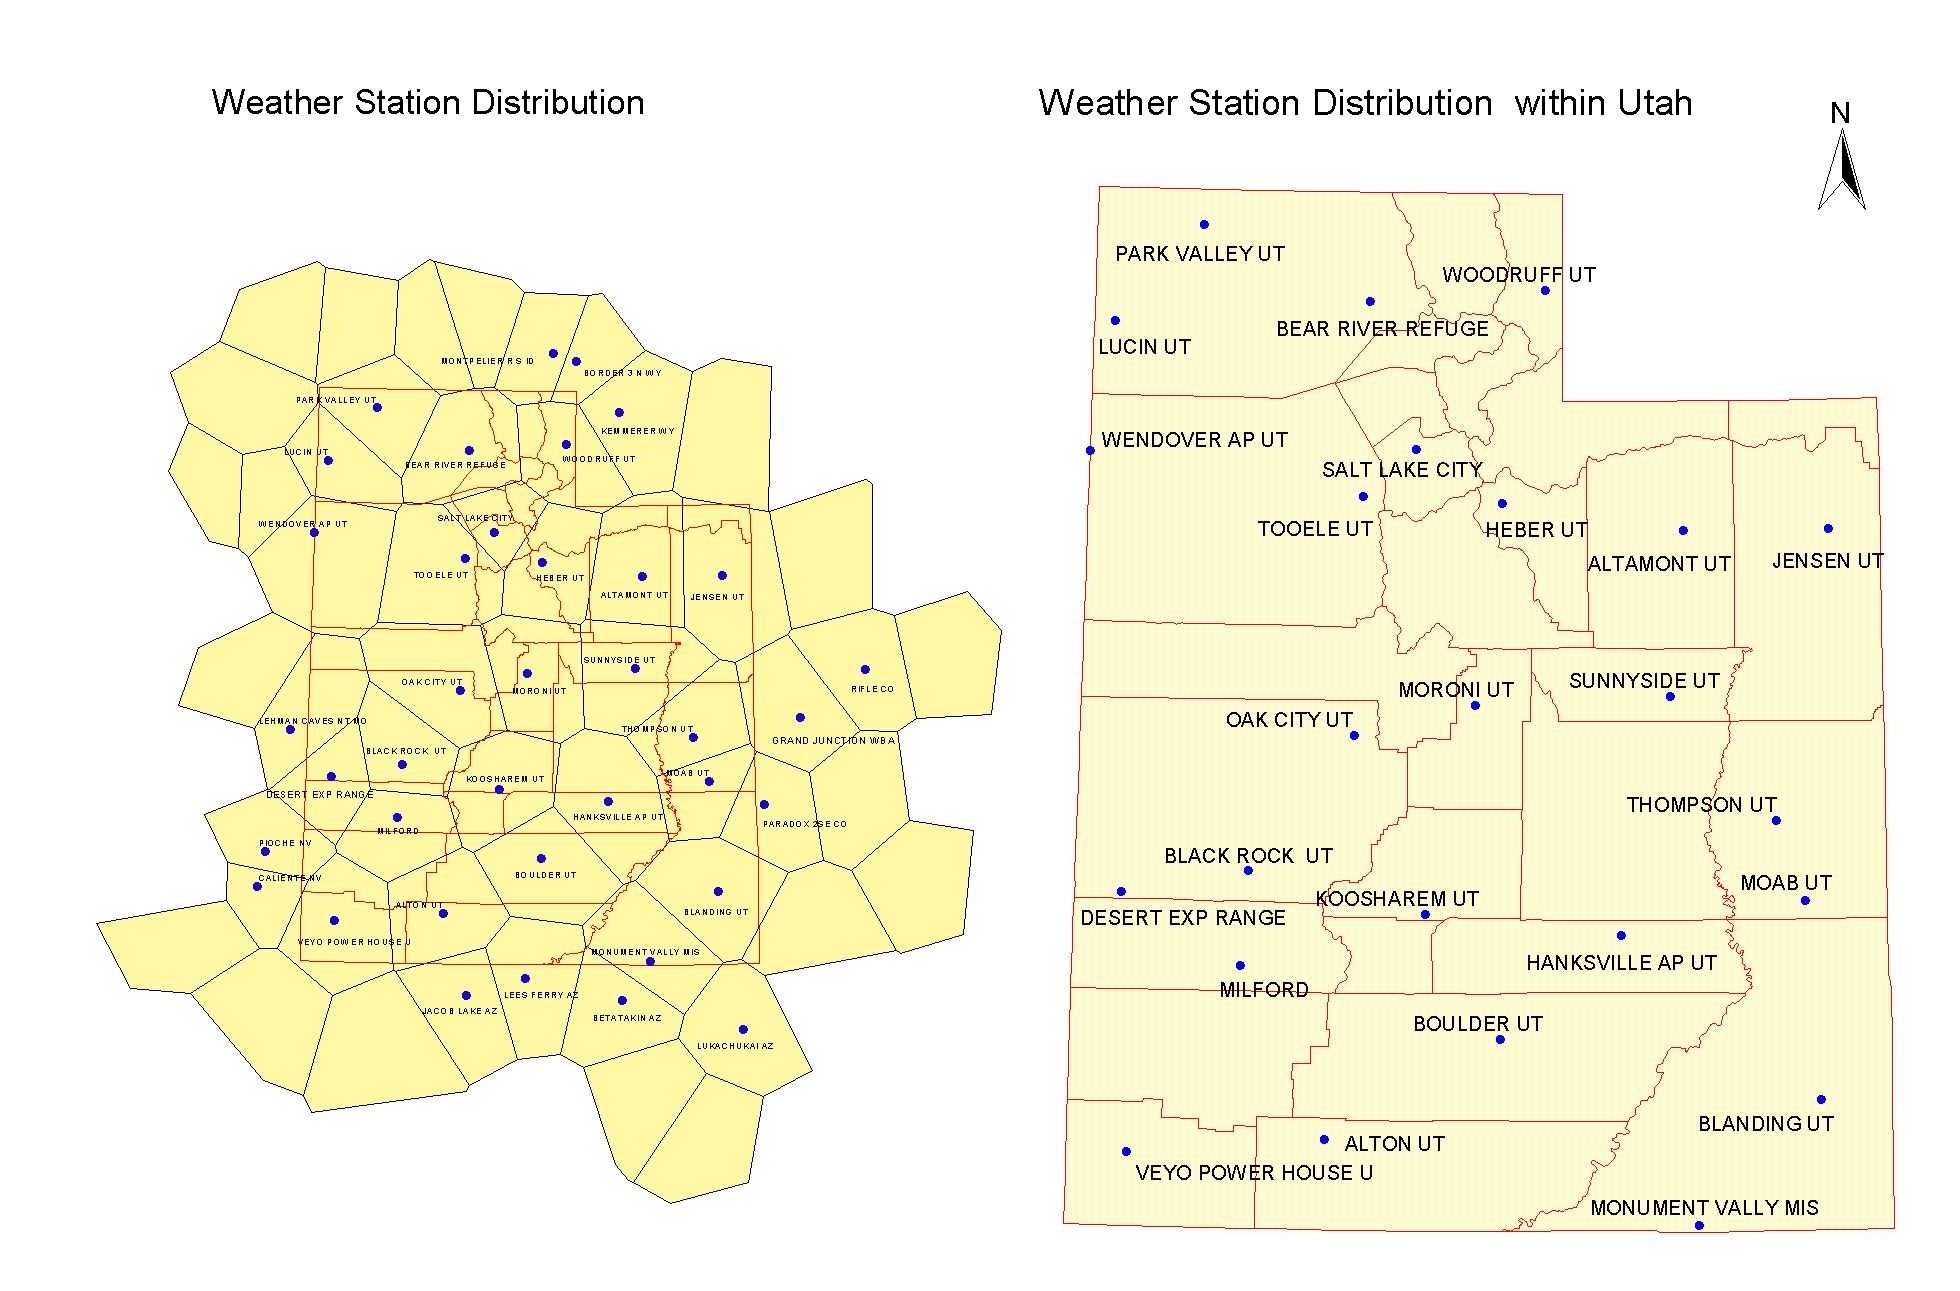
Fig. 03 Distribution of Weather Station
In this data category, following information can be derived:
In the land use dataset, there are only four general agricultural use types, so it is a little difficult to relate specific Kc value to land cover type. Based on the general information about the agricultural land area, four Kc curves as shown in Fig. 04 are decided for the project.
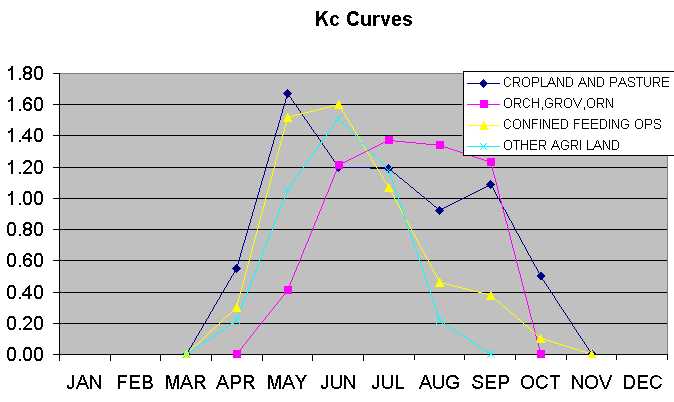
Fig. 04 Crop Coefficient Curve
Many data information is stored in tabluar format out of the GIS dataset, so we need to add such data to GIS dataset to utilize in GIS environment. This can be realized through "Join Table" function in ArcView via key field as shown in the following figure.
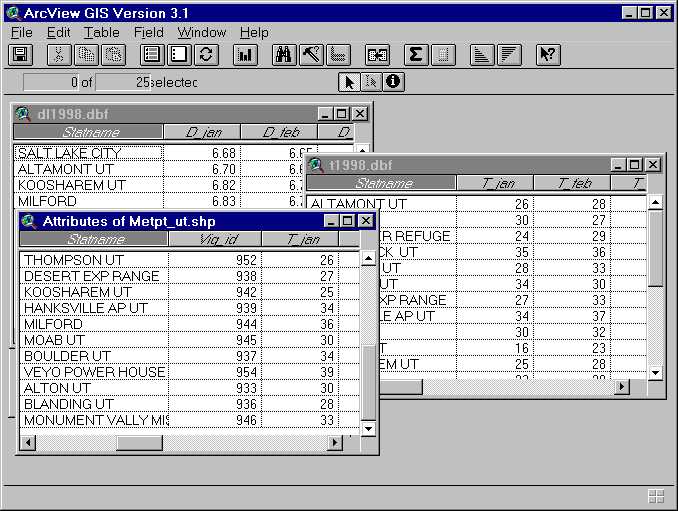
Fig. 05 Procedure of joining Tables
According to above procedure, information on Temperature, Daylight and Crop Coefficient are integrated into GIS dataset, so we can operate these data in ArcView.
ArcView provides calculation function via Map Calculator , but the Map Calculator can only work for grid files. So, the conversion from shape file to grid file is required in order to calculate in ArcView.
Since the crop coefficient information has been added to the land use shape files, we can get the spatial distribution information of Kc value in the agricultural area by convert the crop coefficient shapefile into a grid theme.
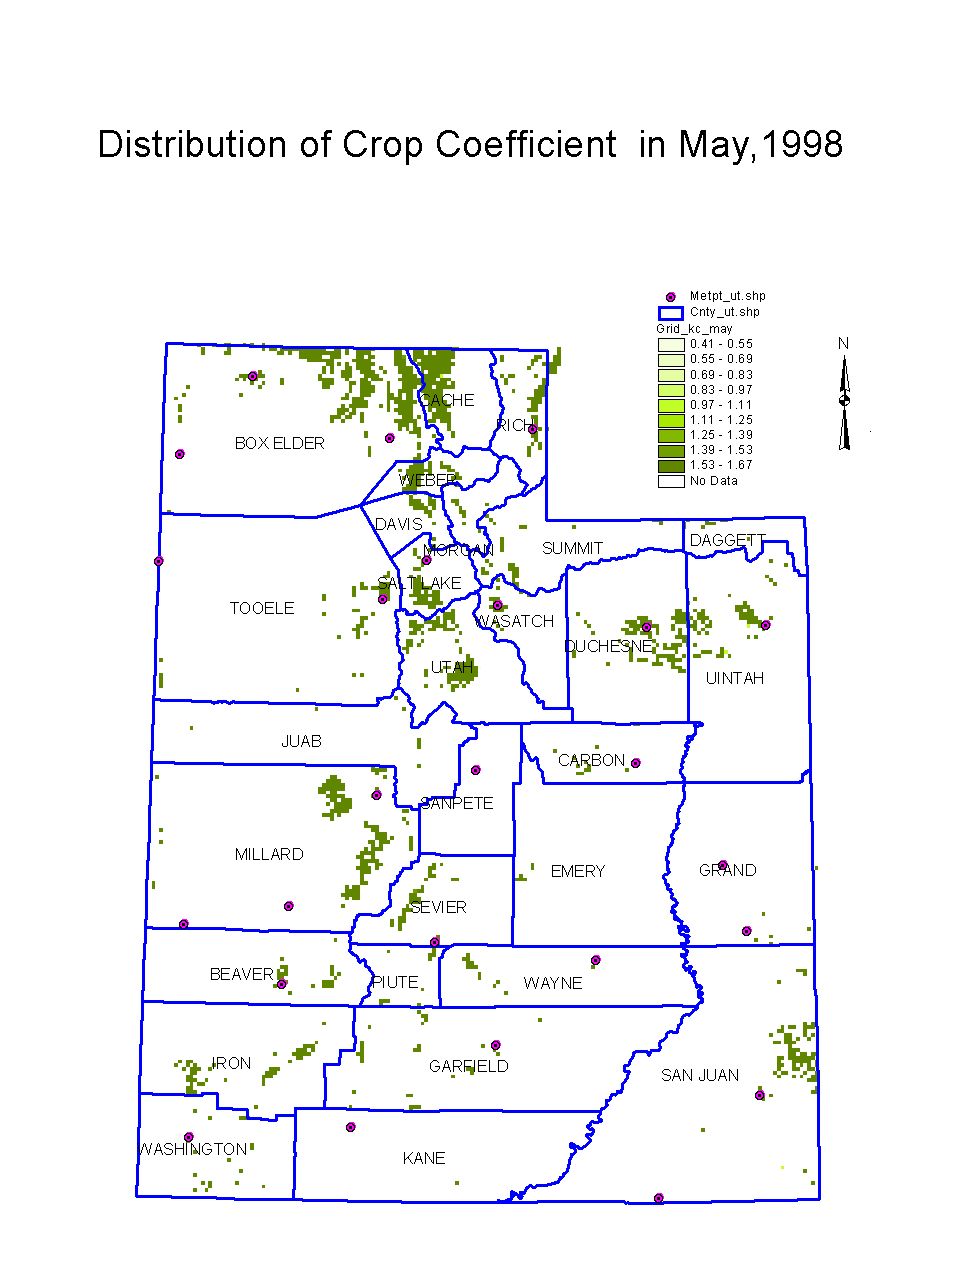
Fig. 06 Distribution of Kc in the agricultural area in grid form.
To do this, add Spatial Analyst extension and select "Interpolate Grid" from "Surface", use "spline" method . Then each climatic parameter in Blaney-Criddle Equation gets a grid theme as following.
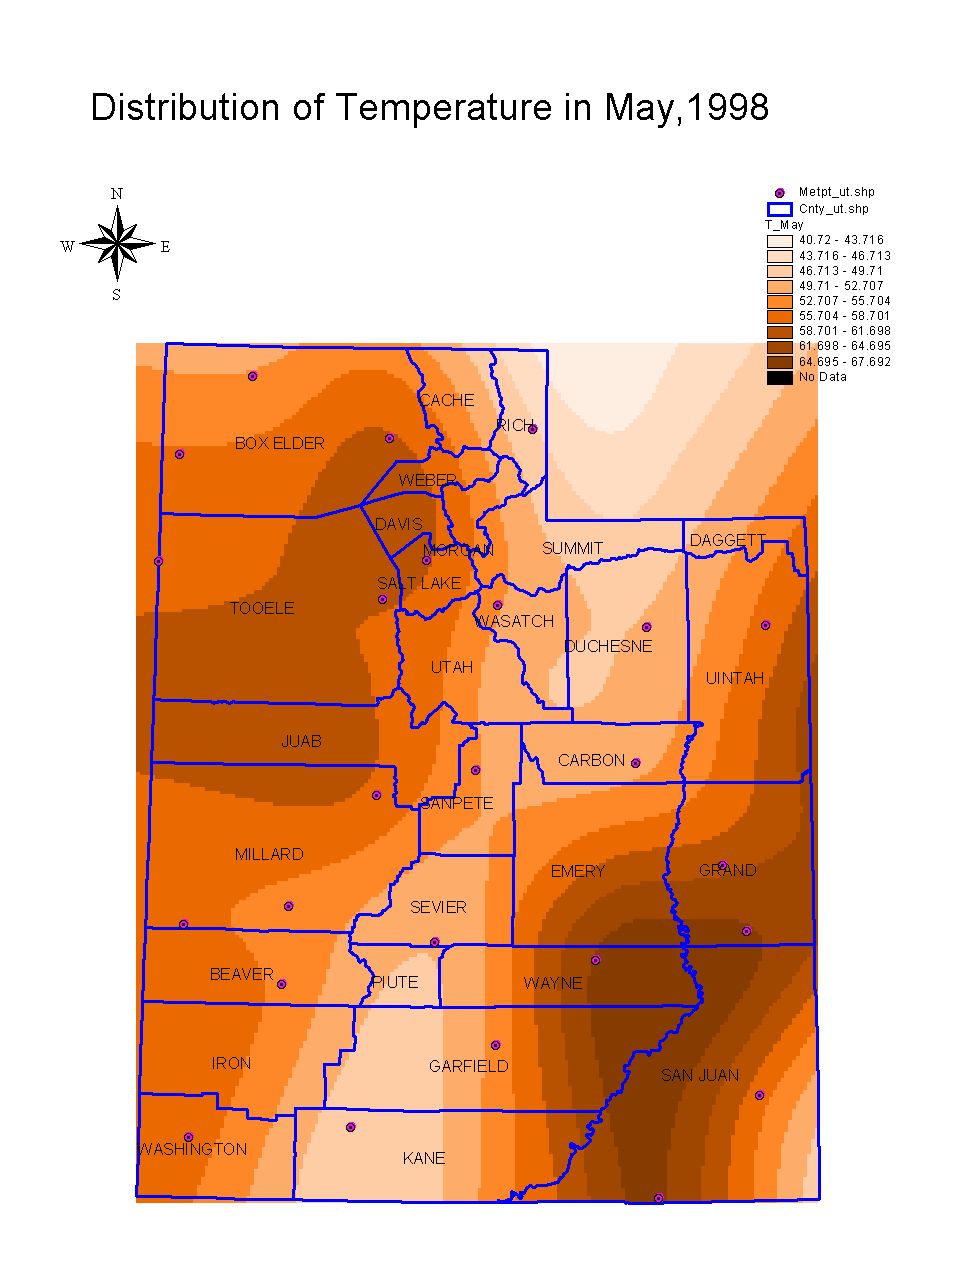
Fig. 07 Gird theme of Distribution of Temperature
Since we have all grid themes for parameters in B-C Equation, we can obtain the monthly evapotranspiration distribution directly via Map Calculator as following figure.
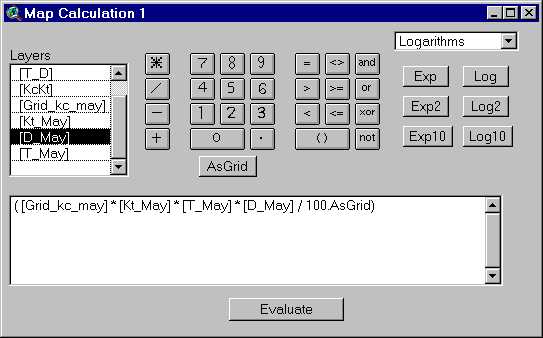
Fig. 08 Map Calculator in ArcView
Data in 1998 is applied for above estimate procedure. The evapotranspiration in each month is calculated and a series of grid themes are generated. The information of evapotranspiration is now visually given.
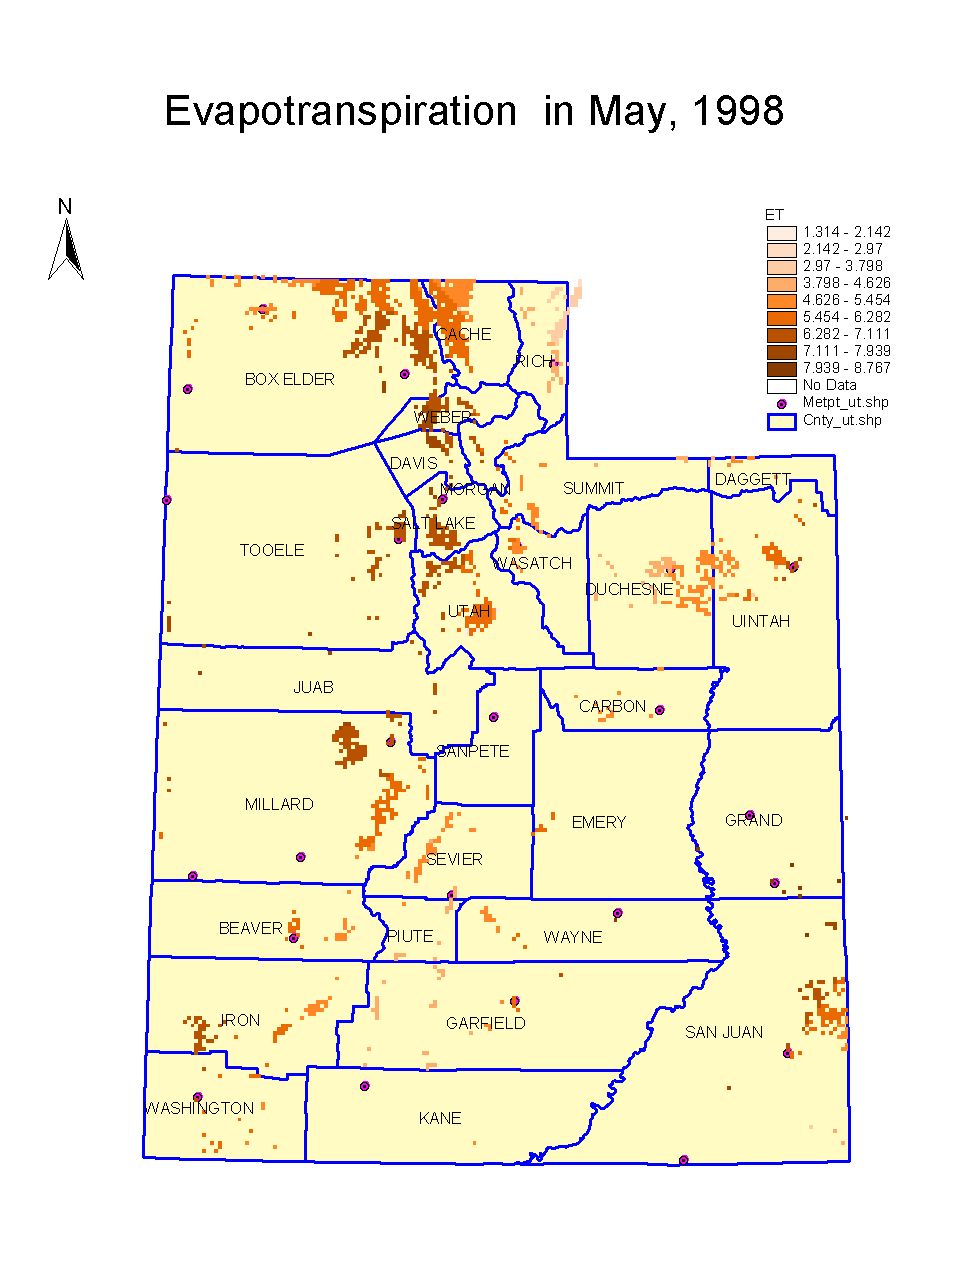
Fig. 09 ET estimate for May,1998
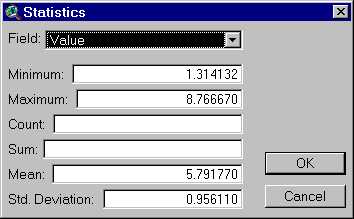
From the ET distribution theme, double click the legend, and then click "Statistics" button, we get Info window as above figure. The mean ET value on the agricultural land of the State of Utah could be derived in this window. Following is the result of monthly ET calculation in 1998.
Tab. 02 Monthly ET Estimate of Utah
|
Month |
Apr |
May |
Jun |
Jul |
Aug |
Sep |
Oct |
|
ET (inches) |
1.037954 |
5.79177 |
5.732254 |
8.386387 |
5.603635 |
4.297427 |
1.008004 |
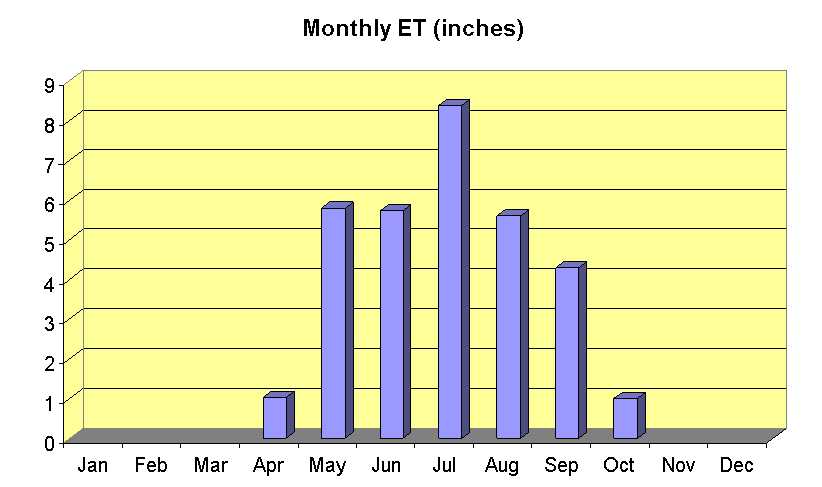
Fig. 10 Monthly ET estimate in 1998
The land cover information provided by the downloaded shape files is not enough to give specific crop type, and this brings us some difficulty in deciding crop coefficient value (Kc). In this term project, the crop coefficient (Kc) curves are taken based on general land types information. In other words, they are approximate. So, land use coverage files containing more detailed land use types are required for statewide water use estimate.
Selection of approaches for ET estimate depends on the availability of climatic data. The only complete data I get is temperature, so I select Blaney-Criddle equation. If more climatic data required by advanced methods could be obtained, the accuracy of ET estimate would be improved.
Another factor that is of importance to ET calculation is the method to decide crop coefficient. The crop coefficient may be hard to be given, especially for estimate of ET in statewide region.
Data permitting, different methods would be used with GIS for ET estimate.
Using Map Calculator could get the ET distribution information, but the manual operation for above estimate procedure would be time consuming and labor intensive if more advanced equations for ET calculation are selected. So, the successful application of GIS in ET estimate would depend on programming for operating GIS.
The regional water use estimate would work on a few aspects of water use (e.g. Industrial & mineral use) besides agricultural water use. GIS also can give us helpful improvements in those aspects of water use estimate. So, in my future research work ,GIS would be applied in the whole project of statewide water use estimate.
Robert W. Hill (1994), Consumptive Use of Irrigated Crops in Utah. Research Final Report, Utah State University.