TauDEM Watershed and Stream Network
Delineation Exercise
Logan River
Prepared by David Tarboton, Utah State University.
Purpose
The purpose of this exercise is to learn how to perform Stream network
delineation in ArcGIS using TauDEM. This is software developed at USU for
hydrologic digital elevation model analysis and watershed delineation and may
be obtained from http://www.neng.usu.edu/dtarb/taudem/.
The component object model (COM)
technology used in ArcGIS enables integration of third party COM objects into
ArcGIS and this capability has been used in this tool.
Exercise
The data needed is in the file LoganRiver.zip. This contains the National Elevation dataset DEM grid obtained from the USGS seamless data server http:/seamless.usgs.gov/ for the Bear River Range East of Logan Utah. This data has been projected to UTM zone 12 on a 30 m grid resampled using cubic interpolation. It also contains the National Hydrography dataset zip file nhdgeo_rockys59173217403.zip obtained from http://nhd.usgs.gov/data.html for the region comprising Cache Valley and the Logan River.
The TauDEM software is available from http://www.neng.usu.edu/dtarb/taudem/. Download the file appropriate for your system (ArcGIS9.x or ArcGIS8.3) then install it.
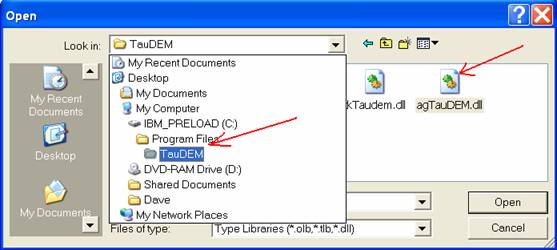
Open ArcMAP and add the TauDEM toolbar. [Click on tools | Customize | Add from file and select the file c:\program files\Taudem\agtaudem.dll]
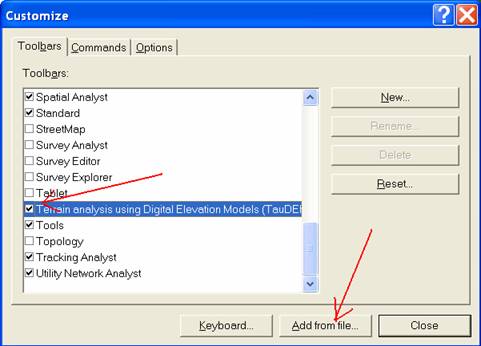
You should get a toolbar that looks like
![]()
This may be docked in a convenient location.
Unzip the file LoganRiver.zip and extract the contents to a convenient location. Add the file 'LoganRiver\ned to ArcMap. Unzip 'nhdgeo_rockys59173217403.zip' and add 'nhdflowline_med.shp' to ArcMap. Click OK to the warning about projections. It is important that you add the ned file first so that the data frame inherits the projection of the DEM and not the NHD flowlines which have not been projected. (You may project the NHD if you like using what you learned in previous exercises, but it is not essential as ArcGIS handles the projection on the fly adequately.)
On the TauDEM toolbar from the Grid Analysis menu 'Select Base DEM grid ...'. You should get a dialog like this:
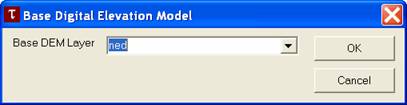
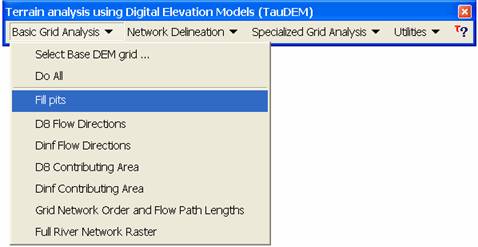
Adjust the Base DEM Layer to be 'ned' and click OK. Next, from the Grid Analysis menu select 'Fill pits'
Check at the dialog that opens that the input grid is 'ned' and the output one 'nedfel'. Ignore the Flow Path Grid items. (The flow path grid items are used if you want to impose existing flow directions along a channel network).
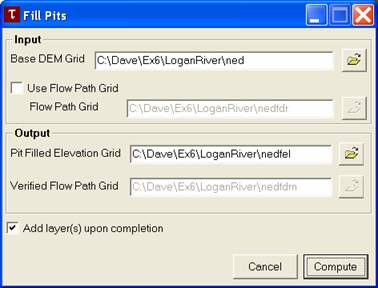
Click on Compute and wait for a few minutes (or more) for the job to complete.
Each of the remaining command under the grid analysis menu can be run in sequence from top to bottom. The program will provide suggested file names for the outputs that follow the convention described in the documentation and given below so you can just click compute at each dialog and have the command execute. [You may learn a bit more about each file by clicking on the file box label in the dialog box associated with each command. You can change the names of input and output grids if you like by editing in the textboxes or using the Browse buttons. If you get an 'Error 1' it means that one of the input grid names specified has a problem. This is commonly caused if commands are run out of sequence.]
Here we will shortcut running each command by selecting the 'Do all preprocessing' command from the 'Grid Processing' menu to have all results generated without any prompts or interuption. Processing of this will take 5 to 10 minutes for the Logan DEM. You should answer OK to the prompt to overwrite the existing 'nedfel' file that you created above or else the automatic processing will stop. A number of output layers will be added to the map. The name suffixes designate the contents according to the file naming convention in the documentation and given at the end of the exercise. Examine these grid layers to understand their contents.
To proceed further and delineate watersheds a shapefile
containing outlet points needs to be created. Open ArcCatalog.
Right Click on the folder 'loganRiver' where you are working and select
'New/Shapefile...'. Set the name 'outlet' and set the feature class to
point. Click 'Edit...' to change the coordinate system then 'Import...'
and select the 'ned' dataset in the 'loganRiver' folder so that the coordinate
system is inherited from this. Click Add, then OK twice. Add the
shapefile 'outlet' to ArcMap. It has no data yet. Display the
editor toolbar (View/Toolbars/Editor) and select Editor/Start Editing.
Select the folder that contains the shapefile 'outlet.shp', and set this as the
target layer. Set the Editor task to 'create new feature' and use the
create new feature button ![]() to carefully locate a point at the outlet of Logan Canyon near the SW corner of
the domain.
to carefully locate a point at the outlet of Logan Canyon near the SW corner of
the domain.
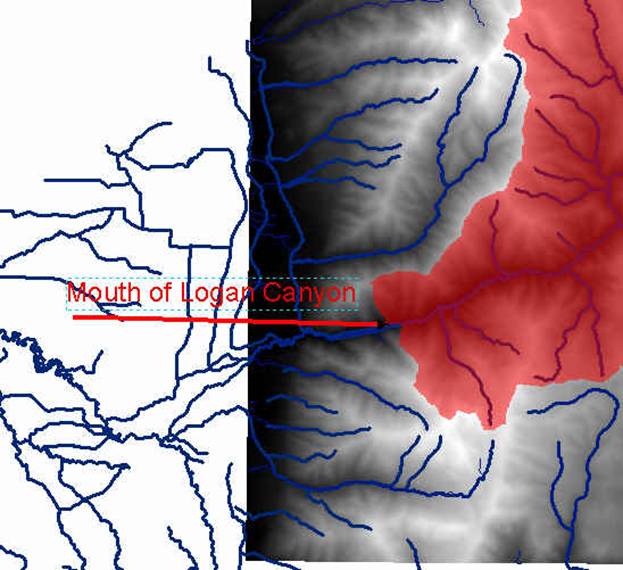
Use the *src layer as a backdrop to ensure that you are locating a point on a
valid stream path. Select Editor/Stop Editing and Save edits. This is now
a one point shapefile. More points for multiple channel networks can be
added if desired. If you are having difficulty creating a shape file with
valid outlet point you may download outlet.shp and use
it.
Now select TauDEM/Network Delineation/Select Outlets Shapefile ... Browse to select the shapefile and click Open and OK. Now select TauDEM/Network Delineation/Do All Network and Watershed Delineation steps. Click OK to delete existing dataset *src. The same file is being reused for writing the grid raster only for the network draining to the outlet. A channel network and watersheds are delineated the TauDEM default settings that automatically does a constant drop test using an upwards curved drainage area threshold to delineate channels. The channel network shapefile 'nednet.shp' has an attribute table that includes among other fields the field 'order' that contains the Strahler stream order. This can be used in symbology to indicate stream order by different colors or line thickness.
Prepare a layout map of the Logan River showing the TauDEM delineated channel network and watersheds draining to each stream segment. On this layout indicate stream orders in different colors or symbols.
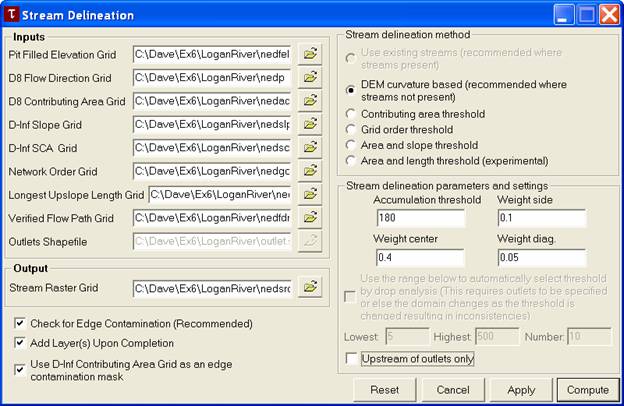
The command 'TauDEM/Network Delineation/River Network Raster Upstream of Outlets' enters a dialog that allows you to select different channel network delineation algorithms and their parameters.
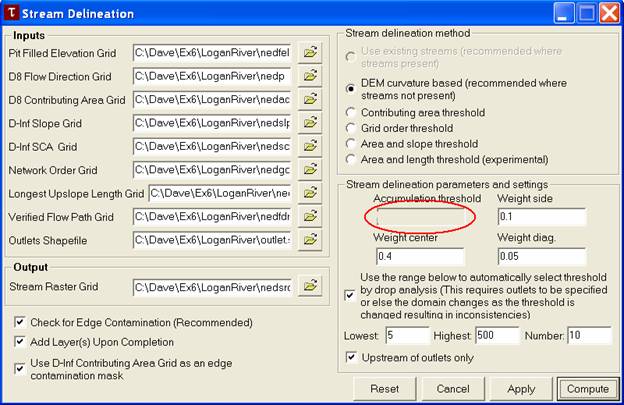
The automatic threshold selection by drop analysis is only possible when outlets are used as was the case above. After stream network delineation has been completed the value in the accumulation threshold box shows the threshold selected by the constant drop procedure. This contains the threshold that was used for delineation of streams in the Logan River Watershed. Note the threshold that was selected by the constant drop test. This will be in gray because it can not be changed while the constant drop analysis is selected.
Report the
accumulation threshold associated with the DEM curvature based approach from
the constant drop test read from this dialog.
Cancel to exit the Stream Delineation dialog. Select TauDEM/Network Analysis/Constant Drop Analysis. You should get a table like
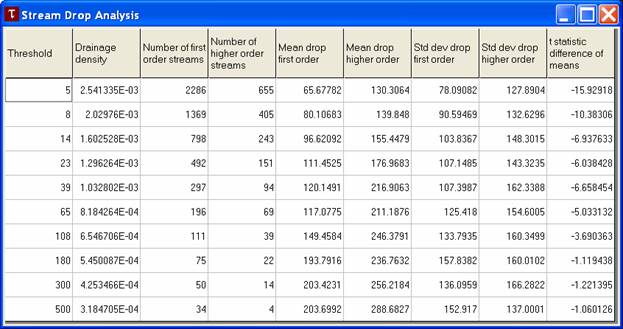
This table shows details of the constant drop analysis that can be used to objectively determine drainage density based upon topographic texture and that is invoked automatically by default controlled by a checkbox within the 'Compute Raster of Network Upstream of Outlets' dialog. The 'Constant Drop Analysis' also reports the drainage density associated with different channel delineation thresholds. The rightmost column gives t statistic values for the t test of the difference between means of first and higher order streams. Verify that the threshold (left column) associated with the smallest threshold for which the absolute value of the t test is less than 2 corresponds to the accumulation threshold used to delineate streams reported above.
Report the Drainage
Density (2nd column in m-1) and number of first order
streams (3rd column) shown in this table for the stream network
delineated previously, i.e. with the accumulation threshold selected earlier.
Close the table and select 'TauDEM/Network Delineation/River Network Raster Upstream of Outlets' to enter the Stream Delineation dialog again. Uncheck the upstream of outlets box. This function is now set to delineate streams over the entire domain, with the threshold that was determined using the watershed that drains to the outlet of the Logan river.
Click Compute. Click OK to overwrite existing files. Then run the commands 'Network Delineation/Stream order grid and network files', 'Network Delineation/Stream shapefile and watershed grid', and 'Network Delineation/Watershed grid to shapefile'. Click OK to overwrite existing files (or rename the outputs). You should now have a stream network and watersheds delineated for the entire DEM domain. Overlay the NHD stream network with streams delineated using the above procedure and examine discrepancies that occur at the north end of this watershed.
Prepare a layout that shows TauDEM delineated streams and watersheds over the domain compared to NHD streams. Use an inset on this layout to identify the problem that occurs at the north end of this watershed where a subwatershed that according to the NHD drains in to the Logan River is in the NED DEM derived channel network diverted to the north.
Rerun the command 'Network Delineation/River Network Raster Upstream of Outlets' but select the "Contributing Area Threshold" method and set the constant drop search to be between 50 and 5000.
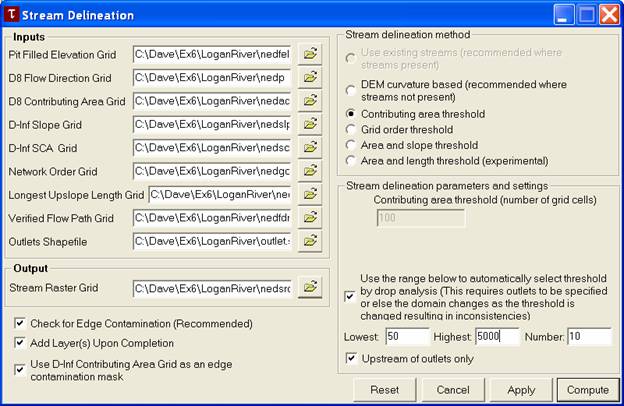
Report the contributing area threshold selected automatically in this case (by re-examining the dialog after the command is run). Report the drainage density identified from the constant drop procedure with contributing area method.
Recall that drainage density is Total Channel Length/Drainage area. Use GIS methods you have learned to determine and report the total channel length and associated drainage area for both the curvature based channel network and contributing area threshold drainage network. Verify the drainage density given by the constant drop analysis for each of these cases.
Select the portion of the NHD river network that drains the Logan River watershed that you delineated. Determine the total channel length of NHD streams within the Logan River watershed and the drainage density associated with the NHD river network.
TauDEM grid naming convention.
The following default naming convention is suggested and
used by the TauDEM software. Any file names may be used with interactive
input, but I suggest sticking to this convention to avoid confusion. File
names are:
nnnnsss
nnnn comprises the name of the dataset. Maximum length is operating system
dependent.
sss comprises the suffix used to designate the data type as follows:
|
no suffix. |
Elevation data. |
|
|
fel |
Pit filled elevation data. |
produced by Fill pits and nondraining hollows |
|
p |
D8 drainage directions. |
produced by D8 flow directions |
|
sd8 |
D8 slopes. |
produced by D8 flow directions |
|
ad8 |
D8 contributing area’s, units are number of grid cells. |
produced by D8 drainage area |
|
slp |
Dinf slopes. |
produced by Dinf flow directions |
|
ang |
Dinf flow directions. |
produced by Dinf flow directions |
|
sca |
Dinf contributing area, units are specific catchment area, i.e. number of grid cells times cell size. |
produced by Dinf drainage area |
|
plen |
Longest path length to each grid point along D8 directions. |
produced by Grid network order, Upslope total flow length, Upslope longest path length function |
|
tlen |
Total path length to each grid point along D8 directions. |
produced by Grid network order, Upslope total flow length, Upslope longest path length function |
|
gord |
Strahler order for grid network defined from D8 flow directions. |
produced by Grid network order, Upslope total flow length, Upslope longest path length function |
|
src |
Network mask based on channel source rules. |
produced by RiverNetwork Raster |
|
ord |
Grid with Strahler order for mapped stream network. |
produced by River Network Raster |
|
w |
Subbasins mapped using subbasinsetup. |
produced Create Network and Sub-Watersheds |
|
fdr |
Flow directions enforced to follow the existing stream network |
produced by Convert Connected Reach Network to Forced Flow Direction Grid |
|
fdrn |
Flow directions enforced to follow the existing stream network after cleaning to remove any loops |
produced by flood when forced flow directions are used |
Summary of answers to turn in
Prepare a layout map of the Logan River showing the
TauDEM delineated channel network and watersheds draining to each stream
segment. On this layout indicate stream orders in different colors or symbols.
Report the
accumulation threshold associated with the DEM curvature based approach from
the constant drop test read from this dialog.
Report the Drainage
Density (2nd column in m-1) and number of first order
streams (3rd column) shown in this table for the stream network
delineated previously, i.e. with the accumulation threshold selected earlier.
Prepare a layout that shows TauDEM delineated streams and
watersheds over the domain compared to NHD streams. Use an inset on this layout
to identify the problem that occurs at the north end of this watershed where a
subwatershed that according to the NHD drains in to the Logan River is in the
NED DEM derived channel network diverted to the north.
Report the contributing area threshold selected automatically in this case (by re-examining the dialog after the command is run). Report the drainage density identified from the constant drop procedure with contributing area method.
Report the total channel length and
associated drainage area for both the curvature based channel network and
contributing area threshold drainage network.
Verify the drainage density given by the constant drop analysis for each
of these cases.
Determine the total channel length of NHD streams within the Logan River watershed and the drainage density associated with the NHD river network.
Ok, you're done!
These materials may be used for study, research, and education, but please
credit the authors and the Utah Water Research Laboratory, Utah State
University. All commercial rights reserved. Copyright 2005 Utah State
University.