Intercomparison Study of Stability Index Models
Kiran Kumar
Chinnayakanahalli
Contents:
Background:
The mathematical models developed by Montgomery and Dietrich (1994), Pack and Tarboton (1998) available for studying high-risk areas of shallow landslides take into account the topography influences on landslide initiation through both concentration of subsurface flow and the effect of gradient on the slope stability.
The SINMAP (Stability INdex MAPping) model is based on the infinite slope stability model that balances the destabilizing components of friction and cohesion on a failure plane parallel to the ground surface with edge effects neglected (Pack and Tarboton, 1998). SINMAP outputs the stability index value, which classifies the terrain stability at each grid location in the study area. The input data set for SINMAP consists of topographic slope and specific catchment area and parameters quantifying material properties and climate (primarily a hydrologic wetness parameter) (Pack and Tarboton, 1998).
The process based slope stability model approach put forward by Montgomery and Dietrich (1994) combines the models for the generation of soil saturation and slope instability with digital terrain data to predict the steady state rainfall necessary for slope failure throughout a study area.
The stability index is defined as the probability that a location is stable assuming uniform distribution of parameters over the ranges specified. This value range between 0 (most unstable) and 1 (stable). Where the most conservative set of parameters (i.e. the set with the most unfavorable combination of parameters for stability) in the model results in stability, the stability index is defined as the factor of safety (ratio of stabilizing to destabilizing forces) at this location (Pack and Tarboton, 1998).
Montgomery and Dietrich model equates the factor of safety to one and then solve for the critical return period (R). Where small R implies unstable regions and large R shows relatively stable regions.
The major differences in these models are SINMAP utilizes the gridbased DEM, whereas Montgomery and Dietrich model uses contour based DEM. They are also different in their approaches dealing uncertainty parameters.
The availability of such models makes it desirable to quantify their efficiency in predicting the landslide points. This study aim at developing a computational method for that can evaluate the models capability to assess the shallow landslide points.
In his explanation of Generalized Likelihood Uncertainty Estimation (GLUE) procedure, Beven(1992) has put forward the point that one should start the modeling exercise with the presupposition that any parameter set combination used to run the model is equally likely as a simulator of the system. He reasons that as there is always some error associated with the model structure and also with the observation and measurement on which the calibration of model is based, there is no robust evidence why one parameter set be considered the best simulator of the system. This method deals with ascribing each parameter set used to run the model a likelihood weight based on comparison between the predicted and the observed values.
The methodology used in this study is closely based on approach described by
Beven and uses Monte Carlo method of simulation to generate parameter set that
is used to run the models. Monte Carlo methods can be described as statistical
simulation that utilizes sequences of random numbers to perform the simulation.
It considers the uniform distribution of the quantity between two values.
Computer language C was used to implement the procedure.
- To develop a computational method to quantify the predictive capability of stability index models and to implement it through a computer program.
- To compare two widely used models, SINMAP and SHALSTAB in the above context.
- To study the effect of
parameter variation on the model for different calibration regions.
SINMAP and SHALSTAB are based on infinite slope model. SHALSTAB is based on Mohr-Coulomb method, which balances the down slope component of soil weight (t ) just at failure with the resistive strength caused by cohesion, C (soil cohesion and/or root strength) and friction due to normal stress on the failure plane.
(http://socrates.berkeley.edu/~geomorph/shalstab/).
t = C + ( s - u ) tanf
(1)
Where,
s = Normal stress
u = Pore pressure that opposes normal component of the weight
f = Angle of internal friction
Although inappropriate in many cases, SHALSTAB equates cohesion to zero. The difficulties involved in obtaining a good estimate of spatially and temporally variable root cohesion seem to be the main reason for such elimination. A version of SHALSTAB in which the soil depth varies spatially, the hydraulic conductivity varies vertically and the cohesion is spatially constant is now referred to as SHALSTAB.V(developed by Dietrich, et al., 1995) (http://socrates.berkeley.edu/~geomorph/shalstab/theory.htm ).
By eliminating the cohesion factor and solving for h/z (the ratio of depth of saturated soil to total depth of the soil at instability), equation (1) can be written as
 (2)
(2)
Where,
rw = Bulk density of water [kg/m3]
rs = Bulk density of soil [kg/m3]
q = Slope angle
From Darcys law we have
qa = kshcosq sinq b (3)
Where,
q = Effective precipitation (rainfall minus evapotranspiration )
ks = Soil conductivity.
a/b = Area per outflow boundary length or Specific catchment area.
If T is the soil transmissivity, working through eqn (2) to (3) hydraulic ratio can be solved as,
![]() (4)
(4)
Equation (4) is the coupled hydrologic-slope stability equation solved by SHALSTAB.
The combination of equations (2) through (4) defines how SHALSTAB categories the area as stable or unstable. It is illustrated in the following table. This study considers the equation (4) for its simulation of SHALSTAB and generates the q/T value instead of the traditional q value.
This is done in order to avoid random generation of T values. In this sense SHALSTAB will not have any variable other than those that appear in SINMAP for which Monte Carlo simulation is used to generate random values in a feasible range. This evades erratic range selection for value of T.
TABLE 1.
|
STABILITY FIELD |
CONDITION |
|
unconditionally stable, saturated |
tanq£ tanf (1-rw /rs); a/b> (T/q)sinq |
|
unconditionally stable, unsaturated |
tanq£ tanf (1-rw /rs ); a/b<(T/q)sinq |
|
unstable, saturated |
a/b>(T/q)sinq; tanf >tanq3tanf (1-rw /rs) |
|
unstable, unsaturated |
a/b<(T/q)sinq; tanf >tanq3tanf (1-rw /rs) |
|
stable, unsaturated |
a/b<(T/q)sinq; tanf>tanq3tanf (1-rw /rs) |
|
unconditionally unstable, saturated |
tanf >tanq; a/b>(T/q)sinq |
|
unconditionally unstable, unsaturated |
tanf >tanq; a/b<(T/q)sinq |
Source: (http://socrates.berkeley.edu/~geomorph/shalstab/theory.htm)
The infinite slope stability model that defines the factor of safety for
SINMAP is given by
( http://www.engineering.usu.edu/dtarb/sinmap.htm
)
![]() (5)
(5)
Where,
Cr = Root Cohesion [ N/m2]
Cs = Soil Cohesion [N/m2]
g = Gravitational acceleration( 9.81 m/s2)
D = Vertical soil depth [m]
Dw = Vertical height of water [m]
h = Soil thickness [m]
hw = Height of water [m]
and h = D cosq .
Then factor of safety is given by,
![]() (6)
(6)
With this form, SINMAP assumes the soil thickness perpendicular to slope as constant.
Where relative wetness, w = Dw/D = hw/h (7)
C= (Cr + Cs)/(D rs g) (8)
C is combined cohesion made dimensionless in relation to perpendicular soil thickness.
r = (rw /rs) (9)
According to the assumptions of the TOPMODEL (Beven and Kirkkb, 1979),
q=Ra (10)
Where,
q = lateral discharge, [m2/hr]
r = Steady state recharge [m/hr]
a = contributing area.
SINMAP differs from the assumptions of TOPMODEL in that it does not consider the varying hydraulic conductivity with depth.
Relative wetness can be written as
w = Min[Ra/Tsinq , 1] (11)
The relative wetness has a maximum value of one, the excess is assumed to form overland flow.
Then the Stability Index takes the form,
 (12)
(12)
This allows uncertainties in C, R/T and tanf. These three together quantify properties of material and climate. The numerical value from the SINMAP model is used to categorize the terrain stability at grid location in study area.
Table 2 gives an example of SI classification that was used in the province
of British Columbia. The selection of breakpoints is subjective, requiring judgment
and interpretation in terms of class definitions (Pack and Tarboton, 1998).
Table 2:
|
Condition |
Class |
Predicted State |
Parameter Range |
Possible Influence of Factors Not Modeled |
|
SI >1.5 |
1 |
Stable slope zone |
Range cannot model instability |
Significant destabilizing factors are required for instability |
|
1.5 >SI> 1.25 |
2 |
Moderately stable zone |
Range cannot model instability |
Moderate destabilizing factors are required for instability |
|
1.25 >SI >1.0 |
3 |
Quasi-stable slope zone |
Range cannot model instability |
Minor destabilizing factors are required for instability |
|
1.0 >SI >0.5 |
4 |
Lower threshold slope zone |
Pessimistic half of range required for instability |
Destabilizing factors are required for instability |
|
0.5> SI> 0.0 |
5 |
Upper threshold slope zone |
Optimistic half of range required for instability |
Stabilizing factors may be responsible for stability |
|
0.0 >SI |
6 |
Defended slope zone |
Range cannot model instability |
Stabilizing factors are required for instability |
Source: (Pack and Tarboton, 1998).
(For more descriptive explanation refer to the work of authors given in the
reference list).
Fig 1: The study area with observed landslide points.
Data pertaining to Block one, Canadian Forest Products, Chetwynd Division, Tree Farm Liccuse 48, British Colombia, Canada, was procured from Dr. Robert T Pack, Research Associate Professor, Civil & Environmental Engineering, USU.
The data consisted of the grid based Digital Elevation Model (DEM), along with shape file of the Observed Landslide points in the region. Dr. Pack also supplied me with the slope and calibration and specific contributing area grids. Running SINMAP extension in Arcview on the DEM of the region can otherwise create these files. The figure shows the area of study along with observed landslide points.
The DEM is in decimal degrees, with,
Cell size = 15
No. of rows = 1861
No. of columns = 3384
No. of observed land slide points = 696.
No. of regions = 9
The computation of factor of safety for SINMAP or q/T for SHALSTAB of observed landslide points requires their slope and contributing area. To obtain such a file consisting of only slope and contributing area, Summarize zones Arcview option was run on landslide shapefile. Landslide points were associated with Contributing area and slope individually. Join table option of Arcview was used to a table consisting of landslide index numbers, slope and contributing area only was obtained (the fields that were of no significance were deleted). Then this table was imported as an ASCII file to be used in the computer program. This considered the entire region and hence the file had the values of slope Contributing area for all the 696 points. To obtain files for individual region, Field TYPE which determines the region to which the landslide belongs must be used to arrive at the slope/contributing area file.
Table 3:
|
Region |
No. of land slide points |
|
1 |
269 |
|
2 |
261 |
|
3 |
2 |
|
4 |
22 |
|
5 |
7 |
|
6 |
0 |
|
7 |
105 |
|
8 |
30 |
|
9 |
0 |
|
Total |
696 |
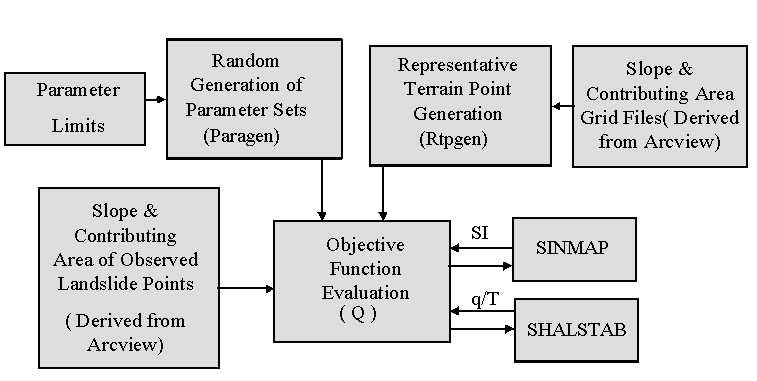
For sake of explanation, lets take the model SINMAP. If SINMAP outputs the value of SI, that predicts the slope stability for a given set of parameter, the methodology aim at attaching a weight of likelihood to the simulation run for a given set of parameter.
The study area has 696 points or grid cells where landslides were observed. The area was divided into 9 regions. Such classification was subjective. Also the entire region was considered as a single entity and studied.
The analysis is performed on two data vectors:
Given a set of parameters say P, (for SINMAP, P consists of ranges for C, phi and R/T randomly generated by Monte-Carlo method of simulation by the program called Paragen)
- Compute SIj for the observed points of landslides. If the entire region is considered, we have 696 values of SI each associated with each of the landslide points. i=1 to 697
- Compute SIi for representative terrain points. These point were randomly picked up from the entire region. If a single region is picked for the study, representative points must be chosen from that region only. 6000 points were generated for the run. (The program Rtpgen does representative point generation). If it is feasible computationally, the entire region must be considered. j= 1 to 6000.
SIj and SIi are ranked from smallest to highest and then normalized to be in the range of 0 and 1. The purpose of such a computation is to have a distribution Fo(SI) and Fr(SI) defined for the observed and the terrain points respectively. Therefore Fo(SI) represents the terrain point with stability index values less than SI. Fr(SI) is the corresponding ranking of Fo(SI) in the domain of representative points. In other words, for SIi(say i=5, i.e. it has the fifth rank in the observed points vector), Fo(SIi), is its normalized ranking, then its corresponding normalized ranking in the vector SIj, is given by Fr(SIj). According to SINMAP, small values of SI represent unstable points in the terrain and so is the case of q/T for SHALSTAB. So if SI is a good indicator, Fo(SI) should climb more steeply than Fr(SI), because the range of SI in Fr(SI) represented over the whole domain is more.
If Q is the area under the curve, and it is between 0 and 1. Q may be used
in allocating a likelihood weight to the parameter set that was used for the
simulation (on lines of Beven, Q will be maximum for the best predicting set of
parameters and least for the worst). If this procedure is repeated for numerous
sets of parameters, each will be having a value Q. The parameter sets
with maximum values of Q will be retained. This methodology is applied to
SHALSTAB and the maximum values given by each model is used to compare the
models.
Flow Chart:
Range of parameters:
Table 4:
|
SINMAP |
Lower Limit |
Upper limit |
|
(R/T)min |
2000 |
2500 |
|
(R/T)max |
2500 |
3000 |
|
Cmax |
0.0 |
0.125 |
|
Cmax |
0.125 |
0.25 |
|
f min |
300 |
37.50 |
|
f max |
37.50 |
450 |
|
SHALSTAB |
|
|
|
f |
300 |
450 |
Above ranges were used for respective parameters to run Monte Carlo simulation to generate parameter sets. 10000 sets of parameters were generated. The computer program was given the name Paramgen.
For easy conceptualization f ranges
are given in degrees, but input to computer was in radians.
Results and Conclusions:
The Figure 5 shows the result of the simulation on SINMAP and SHALSTAB. It can be seen that SINMAP has slightly better predictive capability in the study area. But other things that has to be considered over is the fact that SHASTAB being a deterministic model may not have the required parameter set condition available for which I had the maximum Q value. That is the value of f (0.526992 rad) for which it gave the maximum value may not necessarily exist everywhere in the region. Because of this, SHALSTAB may be considered to give large values of Q, when the parameter is picked up from a bigger range.
Table 5 gives the first five sets of parameter that gave the maximum values
for Q for both SINAMAP and SHALSTAB.
Fig: 4: Graph showing the Objective function curves for SINMAP and SHALSTAB
Table 5:
|
SINMAP |
SHALSTAB |
||||||||
|
Sl. No. |
(R/T)min |
(R/T)max |
Cmin |
Cmax |
f min |
f max |
QSINMAP |
f |
QSHALSTAB |
|
1 |
2488.906 |
2541.353 |
0.124126 |
0.153638 |
0.548863 |
0.662194 |
0.914098 |
0.526992 |
0.901271 |
|
2 |
2474.868 |
2829.142 |
0.124912 |
0.17378 |
0.527914 |
0.782659 |
0.914075 |
0.526928 |
0.901269 |
|
3 |
2472.488 |
2711.188 |
0.122898 |
0.129242 |
0.529377 |
0.776643 |
0.914071 |
0.527016 |
0.901268 |
|
4 |
2487.625 |
2915.235 |
0.124321 |
0.136937 |
0.54508 |
0.770187 |
0.914052 |
0.527024 |
0.901264 |
|
5 |
2465.545 |
2791.406 |
0.124599 |
0.244205 |
0.532457 |
0.722904 |
0.914047 |
0.525194 |
0.901262 |
*f is in radians.
Region wise study:


Fig:5: Graphs showing Objective function curves for different regions.
The objective function, Q was evaluated nine regions making up the study area and it can be seen that each region gave parameter sets that were not similar to that shown in table 5. Also, each of them had a different Q value suggesting that model has predictive capability that varies spatially. Regions that had very few observed landslide points were avoided.
For SINMAP slope and contributing area were the more dominating of the parameters. The Q values did not vary much or had little variance with respect the parameter sets. Q value between 0.910016 to 0.914098, whereas SHALSTAB values were between 0.682008 to 0.901271 for 10000 set of parameters.
Reasoning of Beven, et.al., that one set of parameters cannot be considered
as the best simulator of the system can be seen through the fact that there
were different combination of parameters that resulted in more or less the same
values of Q and for some regions q values were exactly same for many sets.
- Developing an Arcview interface to implement the procedure. The result discussed in this study largely depends on slope and specific contributing area and hence can change from region to region. It therefore becomes important that the algorithm be run for regions before the model can be taken up for the study. Such an interface can be is most suitable with Arcview because it already has extensions that can be used to generate the data needed by the model.
- Would be interesting to see how the models behave if data are derived from different methods. Here main intention is to derive the slope and contributing area files from different methods available. Dµ method was used in this study.
- To study the sensitivity of individual parameters to such an approach.
- Running models for different ranges of parameters to study the parameter space.
Acknowledgements:
Dr. David Tarboton, Associate Professor and Division Head (Water Engineering), Civil & Environmental
Engineering, USU
Dr. Robert T Pack, Research Associate
Professor, Civil & Environmental Engineering, USU
References:
Beven, K., and Binley, A., The Future of Distributed Models: Model Calibration and Uncertainty Estimation, Hydrological Processes,v.6,279-298(1992),1992.
Montgomery, D. R., and Dietrich, W. E., A Physically-Based Model for the Topographic Control on Shallow Landsliding, Water Resources Research, v. 30, p. 1153-1171, 1994.
Pack, R. T. and Tarboton, D. G., New developments in terrain stability mapping in B.C., Proc. of the 11th Vancouver Geotechnical Soc. Symp- Forestry Geotechnique and Resource Engineer., 12p., 1997.